So far we have studied derivatives along with their applications in many different ways. Derivatives are a useful tool when it comes to curve sketching and we want to draw a graph of a given function by taking the derivatives along with analyzing other properties of the function previously studied, such as the continuity, critical points, local maxima, local minima, concavity and others. The derivative of a function is defined as the slope of a line that is tangent to the curve at each point.
There is another important skill that we must have; we should be able to identify from a graph of a function f(x), what the graph of the derivative of that function f’(x) is going to look like or vice versa. Let’s suppose that we are given the next graph of f’(x), our goal is to show how f(x) is probably going to look like, identifying critical points and if is there a local maximum or minimum.
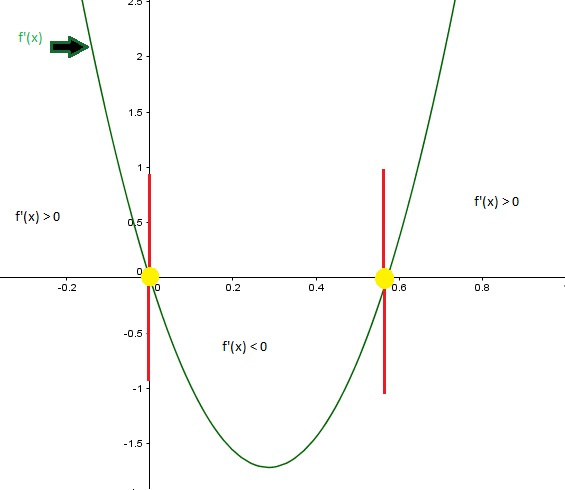
If f'(x) > 0 it means that the slope in the original function is increasing.
If f'(x) < 0 it means that the slope in the original function is decreasing.
In this function we will have first a positive slope, a negative slope and a positive slope again.
The red lines, represent the points where the slope in the original function equals zero. f'(x)=0.
The yellow points represents the critical points.
With this data we can now graph f(x) and identify the critical points, the maximum and minimum, and f(x) should look like this:
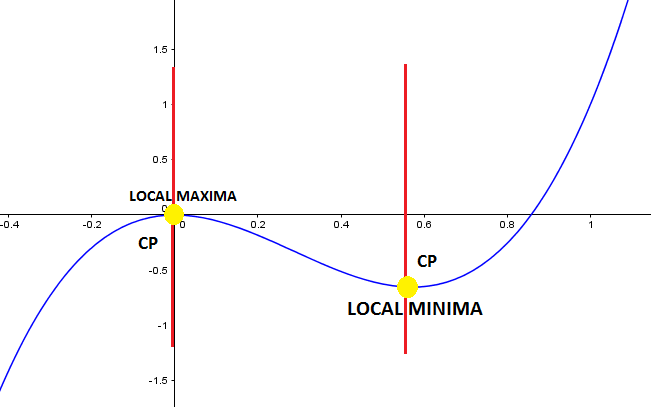 We can prove here that the yellow points are critical points where the slope is equal to zero, where we also have a local maximum and local minimum.
As predicted from the previous graph:
- the function is increasing until it reaches the local maximum where f'(x)=0
- the function start to decrease until it reaches the local minimum where again f'(x)=0.
- the function increases again.
![IMG_6261[1]](https://blogs.ubc.ca/mirkacharpentier/files/2015/11/IMG_62611-e1446806712359.jpg)