Q: Since you are a journalist, putting together maps of housing cost in Vancouver, which classification method would you choose for your audience and why? What if you are a real estate agent preparing a presentation for prospective home buyers near UBC? Are there ethical implications for your choice of classification method? This data is from 2011 – it is now 2017 – should you even be using this data? Discuss.
Answer:
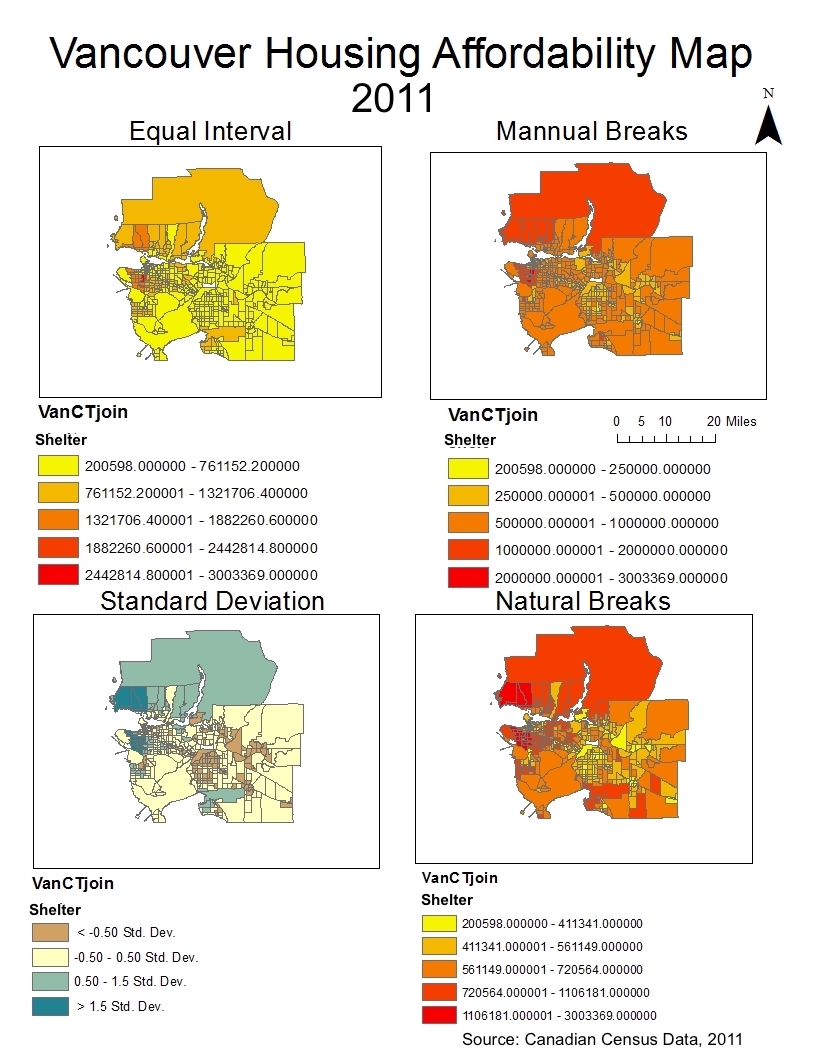
If I am a journalist, I would choose the standard deviation to show the above average value housing and under average value housing (deviations from the mean value) for more social indications about the higher/ lower than average value housing distributions (probably gentrification).
As a real estate agent, I would choose the natural breaks. The natural breaks map is clearer to show the distribution of the different value houses near UBC.There are ethical implications: the SD method highlights the extreme values above and below the average value of housing, while the NB method displays the general different value levels of the distribution of Vancouver housing (focus less on extreme values of isolated CTs, more about a general pattern of all).
Since 6 years have passed since the data was documented and Vancouver has experienced extreme housing value inflation in recent years, I believe that this housing value data is not reliable anymore and I would wait for this years’ data to be released.