All posts by qingyang liu

GEOB 270 Final Project:Vancouver Lost Stream Restoration Assessment

I finished this final project with my other three groupmates: Mingjia, Jackson, and Yixiao. We are interested in the lost streams of Vancouver as seen in the comparison of the map of Vancouver’s streams in 1920 and today’s stream distribution map. We visualized the astonishing number of lost streams by using ArcGIS.

Here are the four maps we made for our final project:


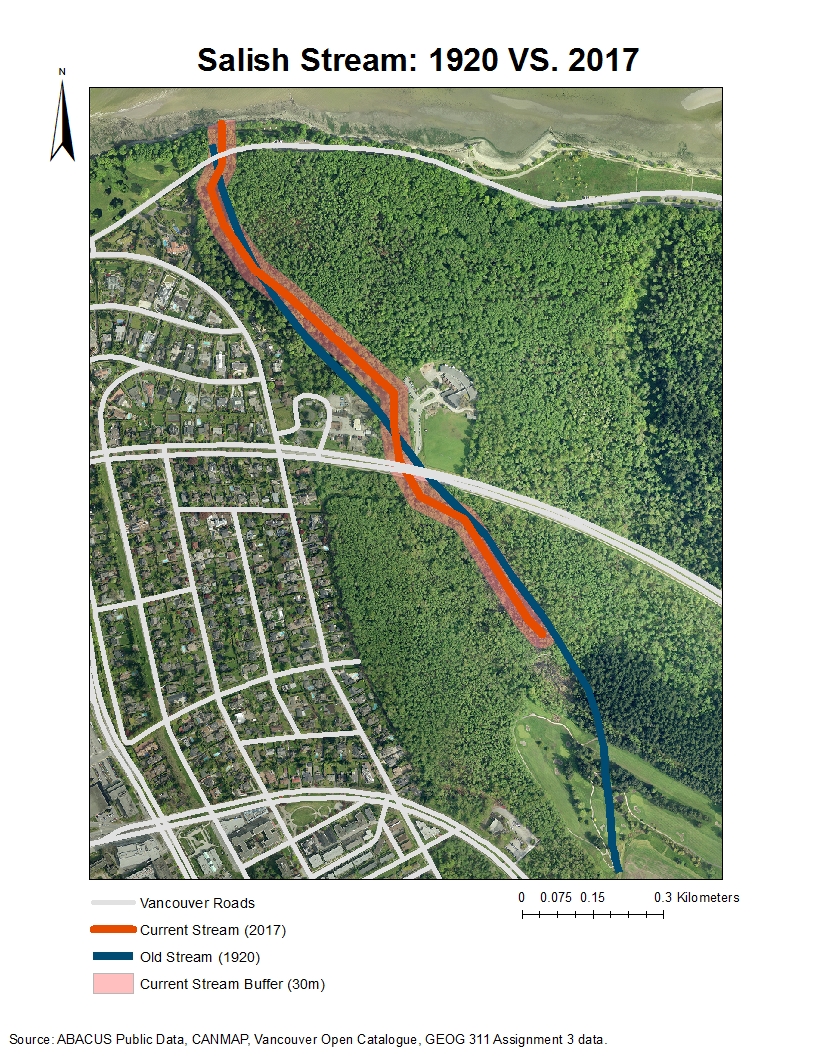
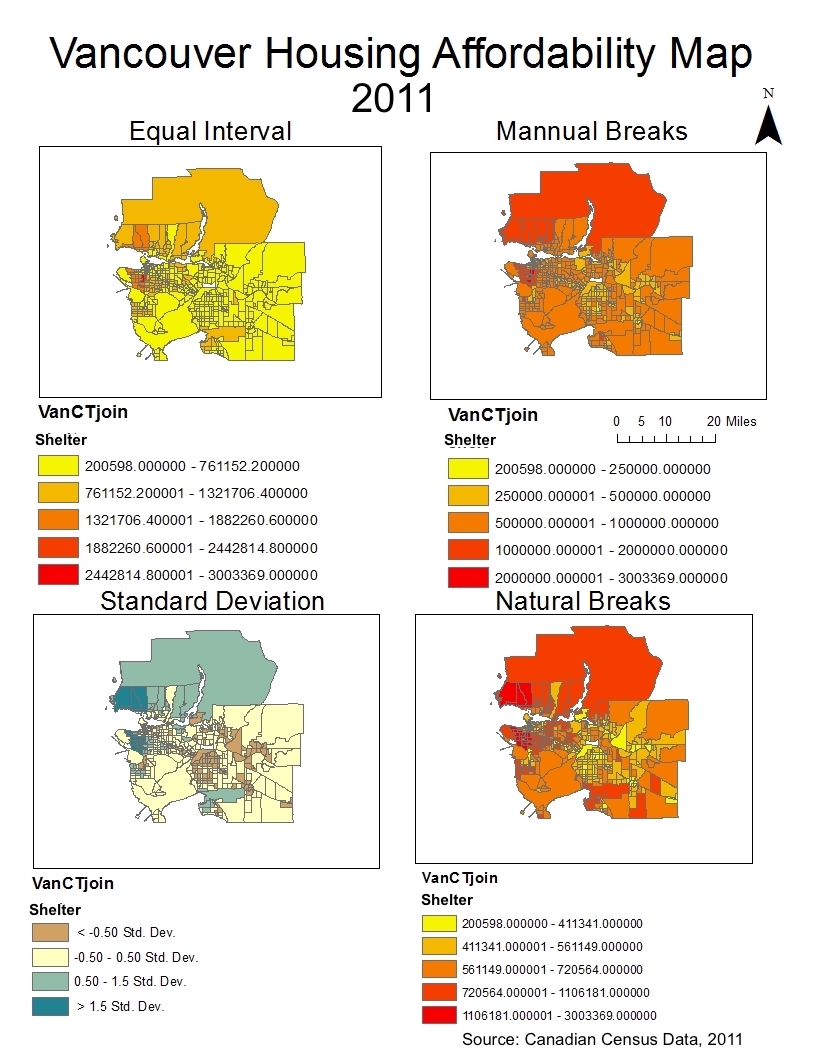
Considering the numerous ecological services these streams may provide to our city, preserving the existing streams and restoring the lost streams should be evaluated by all stakeholders. We believe that the maps above are constructive to further research about identifying the reasons behind the disappearance of Vancouver’s old streams and access future restoration’s practicality. We obtained the Vancouver old stream (1920) data, the Vancouver current road data, the current Vancouver stream data, the Vancouver DEM data, and the Vancouver Zoning labels, to visualize Vancouver’s lost stream’s current states.

I acted as our group’s organizer, striving to assign tasks to everyone efficiently and to keep everyone informed and prepared. We have set up a Google Drive folder to share all the information we find useful for our project, such as scholar articles we find informative for the ecosystem services provided by urban streams, the map and management standards of the Pacific Spirit Park, which is the management department of our case study’s stream, Salish stream, etc. We made the map in the lab collectively, while Jackson documenting our steps of query, using ArcGIS tools, etc., to make the flow chart effectively. I further revised the flow chart before submission. As for the written report, I divided the whole report into several sections for every groupmate to choose. The final division is that I was responsible the report’s outline, the report’s introduction of project, data, and research region, and the case study of Salish Stream; Jackson wrote the report’s error and uncertainty and further research; Mingjia was writing the abstract and methodology of analysis; Yixiao did the discussion of road distribution and the zoning part’s connection with the disappearance of rivers.

The most challenging part for me, as the group’s organizer, is to keep everyone in time for finishing their assigned tasks. Since the whole report was divided among different people, I wish that we could write individual parts in a row to keep the essay’s different sections fluent and comprehensive. However, although we contacted using Wechat, a few group mates of mine were procrastinating and therefore people who should write the following parts were stuck. As the organizer, I find this very stressful in respect of this project’s imminent deadline. I revised the final report and finally luckily and proudly finished the report with all my groupmates.

Besides the difficulty of organizing the division of the report, we also faced some problems at the beginning of the data searching. We easily acquired the data of the old streams of Vancouver from UBC library online. However, we were frustrated by the scarcity of Vancouver streams’ publicly accessible data online. We did find the current river data of Vancouver from Data BC, but this data is restricted and as students, we had no access to obtain it. We were so desperate and even considering changing the topic. Luckily, I suddenly recalled that I have seen a Google Earth kmz file from my GEOG 311 course of the distribution of the current streams in the City of Vancouver. I asked Dr. Christen, the professor of my GEOG 311 course about the source of this kmz file and found out that he digitized the map according to a picture. Since this is the only data we can make use of, I acquired Dr. Christen’s concent of using this data; we successfully transfer the kmz to shp file together using ArcGIS and conducted the further analysis.

All in all, I enjoyed the process of making maps, analyzing, and researching with my groupmates. We were proud of the final maps and report we made.


  • Individual Professional Development

I learn best when I am fascinated by the employment and potential effect of my knowledge. For example, my first time seeing the practicality and efficiency of map making by the example of John Snow, who identified the source of Cholera by making the map of pumps and patients.

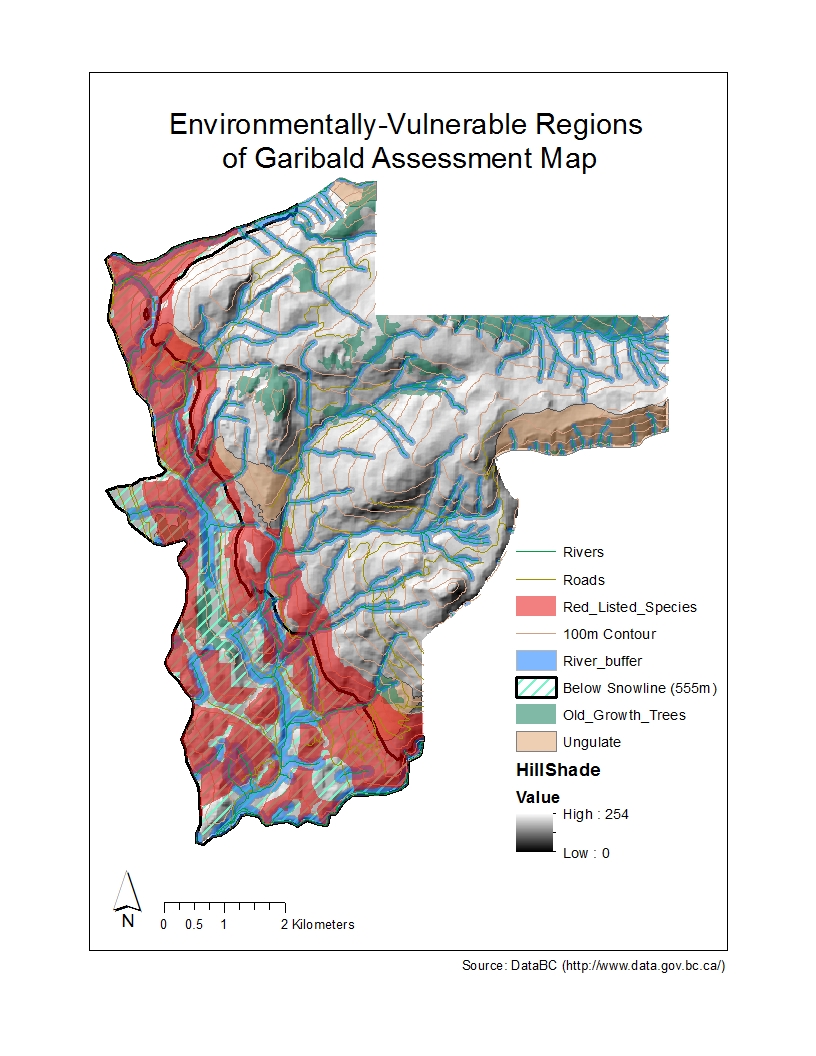
I learn that ArcGIS as an application and a tool could systematically exhibit all my knowledge learn from other courses such as environmental vulnerability assessment, potential hazard assessment, etc.

One thing surprised me about GIS is its connectivity to other  programming languages such as R and Python. Although this is not the content of GEOB 270, I was informed by this course the significance of being able to utilize the programming languages.

My proudest highlight is by making the final project’s maps, I find that I am capable of using ArcGIS alone. I’ve already acquired the basic analysis function of ArcGIS, which makes very excited for my future application of this skill if I’ve gained more geographical knowledge in the following years.

Here is a link to our final report.

Vancouver Lost Stream Restoration Assessment

GEOG 311 Assignment 4: UBC Noise Mapping

Noise is an omnipresent feature of cities and it impacts our life, our health and the behavior and health of urban wildlife. Major sources of anthropogenic noise in cities are traffic (air, land, sea), construction, industrial sources, recreational activities, landscaping. Noise has a range of emotional, physiological and psychological responses that can reach from annoyance, disturbance, to stress, anxiety, all the way to hearing damage.
This project introduces me to the problem of noise pollution in cities. By focusing on a region that we are all familiar with, UBC, we used quantitative methods to assist planning and to map areas of concern, in this case, the problem of noise. This project also aimed at demonstrating the principles of participatory crowd-sourcing of environmental pollution data.
My whole class was divided into 32 different groups to map 16 zones of UBC in daytime (9am-5pm) and evening (7pm-11pm). We used apps on smartphones to document average, peak, and highest sound pressure levels (decibels) of 30 locations (at least 1 min each)within our assigned region during a weekday between March 9 and March 23, 2017. My group’s region is around the central campus, which includes the UBC Bookstore, Beaty Biodiversity Museum, the Engineering Building, etc.
  • Noise level

The average noise level of my group’s data is 66.4db, which is much higher than the approved threshold of 55db of average day noise according to the UBC noise bylaw. The range of my noise data is from 59db to 77db, which indicates even the lowest noise level we measured surpasses the standard of the UBC bylaw. I think it would be considered a violation of students, staff, and residents’ daily life, considering the negative effects noise would do to human health.The dominant sources of noise in my group’s zone are pedestrian’s conversations, student-initiated activities (entertainment), traffics and building ventilation noise. I find in general, the evening noise level is lower than that of the day. I remember the highest value of noise 77db in my group’s region was measured near a student club advertising activity in front of the Bookstore; we categorized this event as “entertainment” and the similar noise issue does not show up in this category of the evening data, which indicates the different on-going activities on campus in different time-period.
In respect of traffic, we find that there are far less traffic activities in the evening: the data of transportation noise is scattered along major roads; on the other hand, that of the day is concentrated along some pedestrian streets that only open in emergency or to maintenance automobiles, which may signify the campus staff’s working time. Similarly, fewer pedestrians are on campus in the evening while more pedestrians make higher decibels of noise at daytime. Buildings’ noise at night is generally lower than that of the day but is still perceptible for the recording. I find the reason might be although the ventilation for most labs are shut down at night, many building functions are still in play all day long.

  • Dominant sources of noise

According to my observation of the loudest noise, I believe it might be beneficial if student organizations are aware of the UBC noise bylaw, which indicates the threshold of the average value of 55db during the Daytime and 45db at night, in respect of Continuous Sound and the Sound Level. Furthermore, considering the large number of data with perception of building noise day and night, it would also be useful if buildings are constructed and renovated with concerns of noise mitigation intelligent design, such as vegetation planting around certain ventilation area, etc.

  • Key areas of noise conflicts

a. Near the Rashpal Dhillon Track & Field Oval

Main source of noise: traffic, construction, sports, pedestrian

Conflict: Since I find most of the noise can be traced back to the “sports” category, I suppose these sports activities are sports events and daily training of general folks, athletes, and audience. Since most of these events happen at day according to the noise map, the noise pollution would not be a huge problem for the nearby neighbourhoods. But considering some sports events or other activities may hold at night, the nearby residents, especially the ones across the Wesbrook Mall may be bothered by the high-level noise.

b. Residence near the TRIUMF House and the Phi Delta Theta Fraternity House

Main source of noise: traffic, construction, pedestrian

Conflict: The highest level of noise of this region are concentrated along the Wesbrook Mall and Thunderbird Blvd. Considering the noise in the evening is still higher than 60db along the Wesbrook Mall, I think the residents along the mall would be affected by the shutting automobiles. In addition, the noise may be traced back to fraternity residents “yelling pass the neighbourhood” according to the news. But this cannot be confirmed since the data is not detailed enough for me to distinguish between traffic noise and pedestrian ones.

c. Near the fountain

Main source of noise: pedestrian, landscape, traffic, building

Conflict: Most of the noise in this region comes from high volume pedestrians due to the intersection of Main Mall and University Blvd, which both function as major pedestrian routes on campus. Many students may wander around the fountain having conversations with friends and buying food from food trucks. In respect of the proximity of adjacent faculty buildings such as Neville Scarfe building, students’ noise may interfere lectures and research.

  • News headlines

Noise makes it often to headlines on our campus, whether the sources of noise are `fraternity students’ (hereherehere, and here), `buildings and maintenance’ (here and here), or even `children’ (here and here). However, I find both the noise of children and fraternity students is not a problem at the time of my measurements. Since my group measured during the day time, scenes like drunk fraternity residents yelling and walking through the community would not happen. On the other hand, in the evening, according to the noise map, although the general noise level around the Fraternity House is higher than that of the normal neighbourhood, I cannot ascribe the noise to fraternity residents due to the on-going traffic, which makes loud noise, on the Wesbrook Mall.

Meanwhile, according to the tags marked by the whole class, I find noise created by children is not concentrated near the Iona Green Playground and the Norma Rose Point School, which most children should make continuous noise according to the news. Children’s noise, according to the noise map, is relatively scattered day and night and not significant when compared to other noise sources such as traffic and pedestrian.

All in all, I find most of the noise is associated with construction, building, traffic, and pedestrians, in which only buildings and constructions accord the complaints reported by the newspaper.

  • Drawbacks and limitations of crowd-sourcing data

A potential drawback of this crowd-sourcing data can be traced back to the device we use—smartphones. I find the microphones of phones easily disturbed by the wind, even mild breeze; although the assignment guideline clearly demonstrated “avoid days with strong wind and rains”, the recently frequent rainy and windy events in Vancouver enhance the possibility that students accidently record the wind instead of the noise level. This potential problem may be reflected on the data map. Higher decibels of noise are distributed along the main corridors, which are also urban canyons: airflow between tall buildings lining aside the streets are accelerated.

Furthermore, I notice some of the measurement points did not sufficiently cover the whole region but along a certain street (eg. Osoyoos Crescent near the Fraternity House), which cannot represent the region’s overall noise level; some points are too close for meaningful documentation; some points are outside the study region. The data collected by the whole class shows some blank area with insufficient data of noise level. Therefore, considering the different standards adopted and questionable qualities of this data, more rigid measurements are in need if the UBC noise data is seriously used for future analysis and policy-making.


GEOG 311 Assignment 3–Urban Streams

For this assignment, I and my group mates Annie and Parkin critically explored a short section of a stream near the Salish Trail in the Pacific Spirit Park, which is embedded in an urban environment.

During our field trip along the stream, following from its upstream channel to the sea, we identified several challenges and pressures on the stream ecosystem due to the nearby or surrounding built environment such as human interference with trash, the underground pipe to help the stream to cross roads, etc.

We also illustrated several ecosystem services the stream ecosystem provides to the urban environment such as habitiats for fish and its storm management function, as well as potential hazards such as landslides.

Some current uses of the stream/or site by diverse stakeholder groups are indicated by this stream’s location near the Point Grey Primary School and UBC.

We also gave some suggestions to the ways the stream has been and could be better redesigned to accommodate diverse groups and diverse theoretical orientations to habitat and parks.

I find the process of employing and integrating what I learned from class (not only GEOG 311, but many other geography courses such as GEOG 270, 211, 102, 103, etc., I took in the last two years) to a real world stream incredibly fascinating.

GEOG 311 Assignment 2 — Community Garden

Assignment 2

For this assignment, I work in the community garden office of the City of Vancouver, with proposing a new site in the City of Vancouver where a potential community garden could be located on public lands (conversion of a section of a park; city boulevards; vacant lots; land around transit lines (major roads, rail and light rapid transit)).

I prepared

1. a one-page map of the outline of the proposed site in that you will compile digitally in Google Earth Pro;

2. a report for your manager on the pros and cons of urban agriculture generally and of this garden location specifically (include rough yield/cost calculations); include in this a description of the specific benefits that should be communicated to local residents within a 1 km radius.

By using the City of Vancouver community gardens website (http://vancouver.ca/people-programs/community-gardens.aspx) and a map of existing gardens, I located a community garden gap in the Arbutus Centre neighbourhood. In order to illustrate why this region is in need of a community garden, where to put the new community garden, and what are the benefits of proposing a new community garden, I did some research on the demography and land-use of this region in accord with the general benefits of building community gardens.

GEOG 311 Assignment 1– Camosun Bog

GEOG 311 Camosun Bog reflection

After a field trip of the Camosun Bog in Pacific Spirit Regional Park, we wrote a reflection in groups. I and my group mates Raquel and Javiera met at the bog and used FieldPress to guide our augmented reality field trip. FieldPress is an open educational resource (OER) that was created by Open Geography at the University of British Columbia . We really enjoyed our time walking around the bog and trail, trying to identify bog species, indigenous species used for traditional medicine, etc. We are deeply impressed by the lesson provided by FieldPress, which introduced us to a new perspective to learn about the environment near us.

Garibald Ski Resort Environmental Assessment

April 3rd, 2017 update:

Well….. I checked again after Prof. Hermansen tried to show us the news but was told by the class that this news was an April Fool’s joke… It was indeed a joke…

——————————————————————————————–

April 2nd, 2017 update:

I just saw a news about this site’s future development plan as the first Disney ski resort yesterday. I was so surprised to be informed by the news that this site’s environmental assessment was finally approved by the government in 2016. Seeing the news after doing my own environmental assessment of this site creates an intimate sense of place and establish a bond between me and the previous unfamiliar site. It is really practical to learn the GISystem, GIScience, and use the ArcGIS program to do real world case studies and analysis.

Here is the link to the news:

http://dailyhive.com/calgary/disney-ski-resort-squamish-vancouver-canada

——————————————————————————————–

  • Proposed Project

The proposed project is a year-round destination mountain resort on Brohm Ridge, which is 80km from Vancouver and 45km south of Whistler. This project was criticized by the BC environmental assessment office, saying that information about the potential risk for the local vegetation, fish habitats, and other ecosystems are not being appropriately valued. I act as a natural planner hired by the project proponents to evaluate the vulnerable regions of this site and make recommendations to the developer about how to preserve the local habitats and ecosystems while successfully developing the ski resort; only after a comprehensive assessment of the environmental impacts, the project could proceed in the future.


  • Analyze steps

I collected the data of rivers, roads, terrestrial ecosystems, old growth trees, ungulate, and elevation from the statistic Canada website. By creating a geodatabase, I put all the datasets pertinent to the study as mentioned above. This helped organize and manage the information through all my layers. Once my relevant layers are imported into the ArcGIS, I cut my data to fit the study region since my focus is this ski resort’s local impact. I applied different tools to represent the data that I believe is important in respect of environmental protection: red-list species of all terrestrial creatures inside the site boundaries; old growth forests in this region; ungulate’s winter activity regions; areas below the snow-line (555m), which is not suitable for development of the ski routes for its low-depth snow cover; varying stream buffer zones (100m adjacent the river below the snowline; 50m above the snowline) that vary due to the different amount of fish habitats in different elevations: more fish activities below the snow-line and less above. Finally, the sum of all the areas of wildlife, fish and vegetation protection areas was calculated; I improve the basic representation to make the map clearer and more visually engaging.


  • General Results

In my analysis, I find about 53% area of the total project area is environmentally sensitive and should be under protection.

The respective areas should be under protection are illustrated in detail below:

Old growth forest: 6.8%

Ungulate (Mule Deer and Mountain Goat): 7.9%

Red-listed species: 24.8%

River buffer (for fish bear stream and riparian ecosystem protection): 26%

Furthermore, 30% area is below the snowline and does not have enough snowfall for the ski development.

  • Environmental Concerns

In my opinion, the two greatest environmental concerns to this project’s development are:

  1. The development area of this site for ski resorts may overlap some wildlife habitats and other ecosystems. Once these regions are disturbed, they are extremely difficult to be restored and the associated ecosystem services are destroyed.
  2. Although human infrastructures may not overlap some wildlife ecosystems, the potential noise, air, light, etc., pollution may put animals in danger. Large animals, as urban avoiders, may be extruded by human activities from this region; small animals like mice act as urban exploiters to exploit human waste and living environment. In this case, human activities may strongly disturb with the original local special ecosystem and may have unknown and irreversible effect.
  • Mitigation ways

However, I do find that as seen in the final map produced for this study, most of the protected areas are concentrated within the region below the snowline, which has been deemed not suitable for ski routes development, as well as around the edges of the project area boundary, which links to the provincial park (not allowed for development). Meanwhile, the significant amount of existing road networks in this region serves well for the construction and the resort’s daily use, minimizing the need for new infrastructure redevelopment.

Therefore, by concentrating the new ski resort development on the above-snowline centre area of the region as well as planning buffer zones for all the sensitive habitats and promoting sustainable design, we could minimize human impacts on this region and achieve a well-balance with the original wildlife habitats. More assessments and research about the local wild species’ diet, habits, hunting regions, etc. are in need.

All in all, even though the initial environmental concerns identified by the Resort Municipality of Whistler and the BC Environmental Assessment Office are legitimate concerns that must be recognized and mediated, I recommend that pending mitigation strategy analyses the proposal for the Garibaldi at Squamish Ski Resort be approved.

  • Ethical concerns

When I firstly got the result that over half of the region are not suitable for human infrastructure development, I personally think the project should not be allowed to continue since we must acknowledge and preserve the ecosystem services other species provide to the whole biosphere. Meanwhile, humans have moral obligation to protect other species. But as an environmental planner who was hired by the project proponents, it is my responsibility to discover the positive side of the ski resort development to this region. This obligation drives me to find the pattern that most of the environmentally important regions are located below the snowline, which coincides the inappropriate regions for ski resort development. That’s to say, developing this site does not

But as an environmental planner who was hired by the project proponents, it is my responsibility to discover the positive side of the ski resort development to this region. This obligation drives me to find the pattern that most of the environmentally important regions are located below the snowline, which coincides the inappropriate regions for ski resort development. That’s to say, developing this site does not mean significant impacts to these sensitive species considering protective buffers would be constructed in the future. This experience of ethical conflict makes me aware that every coin has two sides; I may unravel evidence contradictory to my former conclusion after some efforts.

  • Learning outcomes:

I learned the 7 steps of visualizing data in this lab project and used the first 5 steps to manipulate my data representation:

  1. Acquire – obtain the data
  2. Parse – provide some structure and order for the data
  3. Filter – remove all but the data of interest
  4. Mine – apply methods to discern patterns or context (ArcGIS analysis tools)
  5. Represent – choose a basic visual model

I produced a map and make interpretations and personal opinions on a contentious development project near Squamish, BC that is currently under Environmental Assessment review to assess its potential environmental and economic impacts.

The Stifling Modern Fetishism

This is my most recent project for my VISA 250 printmaking course. After I printed an edition of three on paper, I printed five t-shirts from my carved wooden board. I named this project The Stifling Modern Fetishism. 

I was inspired and astonished by the cruel living environment of the sweatshop in developing countries. The globalized operation and manufacturing of goods today bring job opportunities to these countries’ workers, while these opportunities are highly associated with inhumane and toxic working conditions. As a Chinese girl who read about the high-frequency suicides in Foxconn, Shenzhen, the biggest Apple manufacturer in the world, I felt the urgency to uncover the struggles of developing world workers (mostly female) behind the shiny new iPhones and other commodities.

Interestingly, most people see this project as a critique of people playing with their phones all day long in all places without caring about the ongoing events nearby, like humans are controlled by phones. I also like this interpretation and find in both cases, our obsession to commodities, in this case, phones, lead to detrimental effects. Therefore I name this project as The Stifling Modern Fetishism.

Vancouver Housing affordability Assessment


  • Q: What is affordability measuring, and why is it a better indicator of

housing affordability than housing cost alone?

A: Housing affordability is measured in comparison to household incomes. The index is the house price-to-income ratio. Since different places in the world may have different economic levels, average salary, and living cost standards, having this indicator associated with incomes could better represent the local residents’ ability to purchase housing.

  • Q: What are the housing affordability rating categories? Who determined them and are they to be ‘trusted’? (You have seen in the previous map how different classification breaks produce very different visual impressions).

A: The rating categories are affordable (Median house price divided by median household income: 3 and under), moderately unaffordable (3-4), seriously unaffordable (4-5), severely unaffordable (5 and over). These categories are determined by the median multiple index: Median house price divided by median household income. They are to be trusted by most studies and evaluations today.

  • Q: Is affordability a good indicator of a city’s ‘livability’?

A: Since housing is the very need for all people in the world, failing to find suitable and affordable shelters would lead to numerous serious social problems such as gentrification (poor people being evicted by the rich), decreasing potential standards of living, increasing poverty rates, diminishing discretionary incomes, decreasing happiness level of citizens, etc. I see it a strange paradox that Vancouver been ranked by the NO.3 most livable city in the world but also being one of the cities with unaffordable housing in the world. Is this livability evaluated by citizens or rich foreign investors?

Quantitative Data Classification


Q: Since you are a journalist, putting together maps of housing cost in Vancouver, which classification method would you choose for your audience and why?  What if you are a real estate agent preparing a presentation for prospective home buyers near UBC? Are there ethical implications for your choice of classification method? This data is from 2011 – it is now 2017 – should you even be using this data? Discuss.

Answer:

If I am a journalist, I would choose the standard deviation to show the above average value housing and under average value housing (deviations from the mean value) for more social indications about the higher/ lower than average value housing distributions (probably gentrification).

As a real estate agent, I would choose the natural breaks. The natural breaks map is clearer to show the distribution of the different value houses near UBC.There are ethical implications: the SD method highlights the extreme values above and below the average value of housing, while the NB method displays the general different value levels of the distribution of Vancouver housing (focus less on extreme values of isolated CTs, more about a general pattern of all).

Since 6 years have passed since the data was documented and Vancouver has experienced extreme housing value inflation in recent years, I believe that this housing value data is not reliable anymore and I would wait for this years’ data to be released.

Lab 3

Lab3 Vancouver Tsunami Dangerous Map

Lab3 map St hospital

1. List the healthcare and educational facilities within the Vancouver danger zone, if any, and explain how you came up with your answer.

Facilities:

EMILY CARR INSTITUTE OF ART & DESIGN (ECIAD)

HENRY HUDSON ELEMENTARY

FALSE CREEK ELEMENTARY

ST ANTHONY OF PADUA

ECOLE ROSE DES VENTS

FALSE CREEK RESIDENCE

VILLA CATHAY CARE HOME

BROADWAY PENTECOSTAL LODGE

YALETOWN HOUSE SOCIETY


I used the selection by location tool to select education and healthcare layers from Vancouver danger. I then used the merge tool to merge these two layers into the same layer.

2. Provide a one or 2 sentence discussion of any potential risk to the new site for St. Paul’s Hospital.

Risk: the hospital might be flooded during the tsunami due to its low elevation. Furthermore, since it is built on a tidal flat, which has loose soil that may suffer from liquefaction during an earthquake, the hospital also may be in danger during an earthquake.