Tag Archives: #affordabililty

GEOG 311 Assignment 2 — Community Garden

Assignment 2

For this assignment, I work in the community garden office of the City of Vancouver, with proposing a new site in the City of Vancouver where a potential community garden could be located on public lands (conversion of a section of a park; city boulevards; vacant lots; land around transit lines (major roads, rail and light rapid transit)).

I prepared

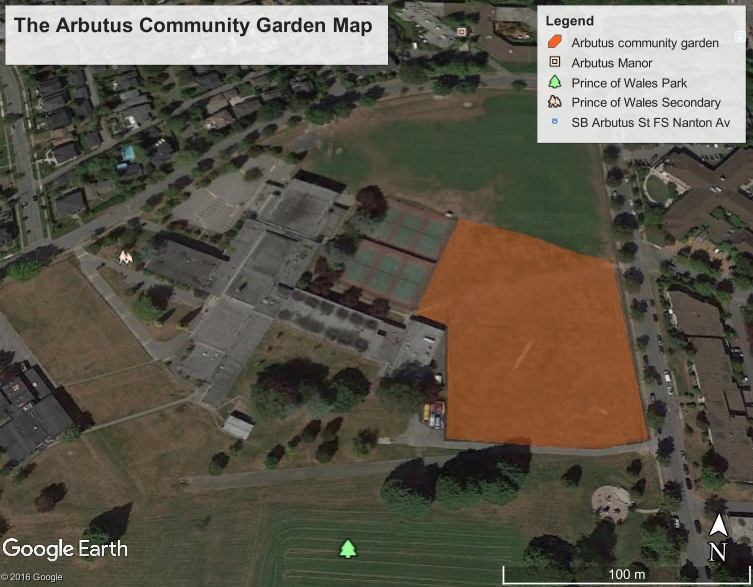
1. a one-page map of the outline of the proposed site in that you will compile digitally in Google Earth Pro;

2. a report for your manager on the pros and cons of urban agriculture generally and of this garden location specifically (include rough yield/cost calculations); include in this a description of the specific benefits that should be communicated to local residents within a 1 km radius.

By using the City of Vancouver community gardens website (http://vancouver.ca/people-programs/community-gardens.aspx) and a map of existing gardens, I located a community garden gap in the Arbutus Centre neighbourhood. In order to illustrate why this region is in need of a community garden, where to put the new community garden, and what are the benefits of proposing a new community garden, I did some research on the demography and land-use of this region in accord with the general benefits of building community gardens.

Vancouver Housing affordability Assessment


  • Q: What is affordability measuring, and why is it a better indicator of

housing affordability than housing cost alone?

A: Housing affordability is measured in comparison to household incomes. The index is the house price-to-income ratio. Since different places in the world may have different economic levels, average salary, and living cost standards, having this indicator associated with incomes could better represent the local residents’ ability to purchase housing.

  • Q: What are the housing affordability rating categories? Who determined them and are they to be ‘trusted’? (You have seen in the previous map how different classification breaks produce very different visual impressions).

A: The rating categories are affordable (Median house price divided by median household income: 3 and under), moderately unaffordable (3-4), seriously unaffordable (4-5), severely unaffordable (5 and over). These categories are determined by the median multiple index: Median house price divided by median household income. They are to be trusted by most studies and evaluations today.

  • Q: Is affordability a good indicator of a city’s ‘livability’?

A: Since housing is the very need for all people in the world, failing to find suitable and affordable shelters would lead to numerous serious social problems such as gentrification (poor people being evicted by the rich), decreasing potential standards of living, increasing poverty rates, diminishing discretionary incomes, decreasing happiness level of citizens, etc. I see it a strange paradox that Vancouver been ranked by the NO.3 most livable city in the world but also being one of the cities with unaffordable housing in the world. Is this livability evaluated by citizens or rich foreign investors?

Quantitative Data Classification


Q: Since you are a journalist, putting together maps of housing cost in Vancouver, which classification method would you choose for your audience and why?  What if you are a real estate agent preparing a presentation for prospective home buyers near UBC? Are there ethical implications for your choice of classification method? This data is from 2011 – it is now 2017 – should you even be using this data? Discuss.

Answer:

If I am a journalist, I would choose the standard deviation to show the above average value housing and under average value housing (deviations from the mean value) for more social indications about the higher/ lower than average value housing distributions (probably gentrification).

As a real estate agent, I would choose the natural breaks. The natural breaks map is clearer to show the distribution of the different value houses near UBC.There are ethical implications: the SD method highlights the extreme values above and below the average value of housing, while the NB method displays the general different value levels of the distribution of Vancouver housing (focus less on extreme values of isolated CTs, more about a general pattern of all).

Since 6 years have passed since the data was documented and Vancouver has experienced extreme housing value inflation in recent years, I believe that this housing value data is not reliable anymore and I would wait for this years’ data to be released.