Tag Archives: #geob270

GEOB 270 Final Project:Vancouver Lost Stream Restoration Assessment

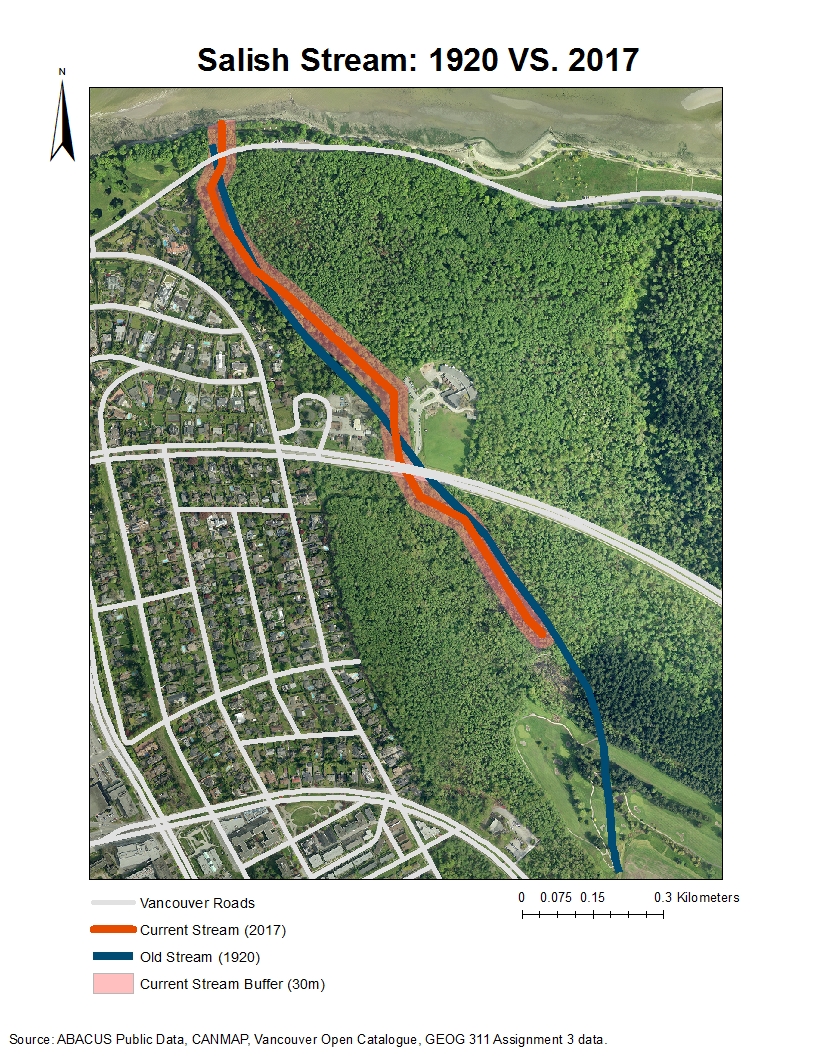
I finished this final project with my other three groupmates: Mingjia, Jackson, and Yixiao. We are interested in the lost streams of Vancouver as seen in the comparison of the map of Vancouver’s streams in 1920 and today’s stream distribution map. We visualized the astonishing number of lost streams by using ArcGIS.

Here are the four maps we made for our final project:


Considering the numerous ecological services these streams may provide to our city, preserving the existing streams and restoring the lost streams should be evaluated by all stakeholders. We believe that the maps above are constructive to further research about identifying the reasons behind the disappearance of Vancouver’s old streams and access future restoration’s practicality. We obtained the Vancouver old stream (1920) data, the Vancouver current road data, the current Vancouver stream data, the Vancouver DEM data, and the Vancouver Zoning labels, to visualize Vancouver’s lost stream’s current states.

I acted as our group’s organizer, striving to assign tasks to everyone efficiently and to keep everyone informed and prepared. We have set up a Google Drive folder to share all the information we find useful for our project, such as scholar articles we find informative for the ecosystem services provided by urban streams, the map and management standards of the Pacific Spirit Park, which is the management department of our case study’s stream, Salish stream, etc. We made the map in the lab collectively, while Jackson documenting our steps of query, using ArcGIS tools, etc., to make the flow chart effectively. I further revised the flow chart before submission. As for the written report, I divided the whole report into several sections for every groupmate to choose. The final division is that I was responsible the report’s outline, the report’s introduction of project, data, and research region, and the case study of Salish Stream; Jackson wrote the report’s error and uncertainty and further research; Mingjia was writing the abstract and methodology of analysis; Yixiao did the discussion of road distribution and the zoning part’s connection with the disappearance of rivers.

The most challenging part for me, as the group’s organizer, is to keep everyone in time for finishing their assigned tasks. Since the whole report was divided among different people, I wish that we could write individual parts in a row to keep the essay’s different sections fluent and comprehensive. However, although we contacted using Wechat, a few group mates of mine were procrastinating and therefore people who should write the following parts were stuck. As the organizer, I find this very stressful in respect of this project’s imminent deadline. I revised the final report and finally luckily and proudly finished the report with all my groupmates.

Besides the difficulty of organizing the division of the report, we also faced some problems at the beginning of the data searching. We easily acquired the data of the old streams of Vancouver from UBC library online. However, we were frustrated by the scarcity of Vancouver streams’ publicly accessible data online. We did find the current river data of Vancouver from Data BC, but this data is restricted and as students, we had no access to obtain it. We were so desperate and even considering changing the topic. Luckily, I suddenly recalled that I have seen a Google Earth kmz file from my GEOG 311 course of the distribution of the current streams in the City of Vancouver. I asked Dr. Christen, the professor of my GEOG 311 course about the source of this kmz file and found out that he digitized the map according to a picture. Since this is the only data we can make use of, I acquired Dr. Christen’s concent of using this data; we successfully transfer the kmz to shp file together using ArcGIS and conducted the further analysis.

All in all, I enjoyed the process of making maps, analyzing, and researching with my groupmates. We were proud of the final maps and report we made.


  • Individual Professional Development

I learn best when I am fascinated by the employment and potential effect of my knowledge. For example, my first time seeing the practicality and efficiency of map making by the example of John Snow, who identified the source of Cholera by making the map of pumps and patients.

I learn that ArcGIS as an application and a tool could systematically exhibit all my knowledge learn from other courses such as environmental vulnerability assessment, potential hazard assessment, etc.

One thing surprised me about GIS is its connectivity to other  programming languages such as R and Python. Although this is not the content of GEOB 270, I was informed by this course the significance of being able to utilize the programming languages.

My proudest highlight is by making the final project’s maps, I find that I am capable of using ArcGIS alone. I’ve already acquired the basic analysis function of ArcGIS, which makes very excited for my future application of this skill if I’ve gained more geographical knowledge in the following years.

Here is a link to our final report.
Vancouver Lost Stream Restoration Assessment

Garibald Ski Resort Environmental Assessment

April 3rd, 2017 update:

Well….. I checked again after Prof. Hermansen tried to show us the news but was told by the class that this news was an April Fool’s joke… It was indeed a joke…

——————————————————————————————–

April 2nd, 2017 update:

I just saw a news about this site’s future development plan as the first Disney ski resort yesterday. I was so surprised to be informed by the news that this site’s environmental assessment was finally approved by the government in 2016. Seeing the news after doing my own environmental assessment of this site creates an intimate sense of place and establish a bond between me and the previous unfamiliar site. It is really practical to learn the GISystem, GIScience, and use the ArcGIS program to do real world case studies and analysis.

Here is the link to the news:

http://dailyhive.com/calgary/disney-ski-resort-squamish-vancouver-canada

——————————————————————————————–

  • Proposed Project

The proposed project is a year-round destination mountain resort on Brohm Ridge, which is 80km from Vancouver and 45km south of Whistler. This project was criticized by the BC environmental assessment office, saying that information about the potential risk for the local vegetation, fish habitats, and other ecosystems are not being appropriately valued. I act as a natural planner hired by the project proponents to evaluate the vulnerable regions of this site and make recommendations to the developer about how to preserve the local habitats and ecosystems while successfully developing the ski resort; only after a comprehensive assessment of the environmental impacts, the project could proceed in the future.


  • Analyze steps

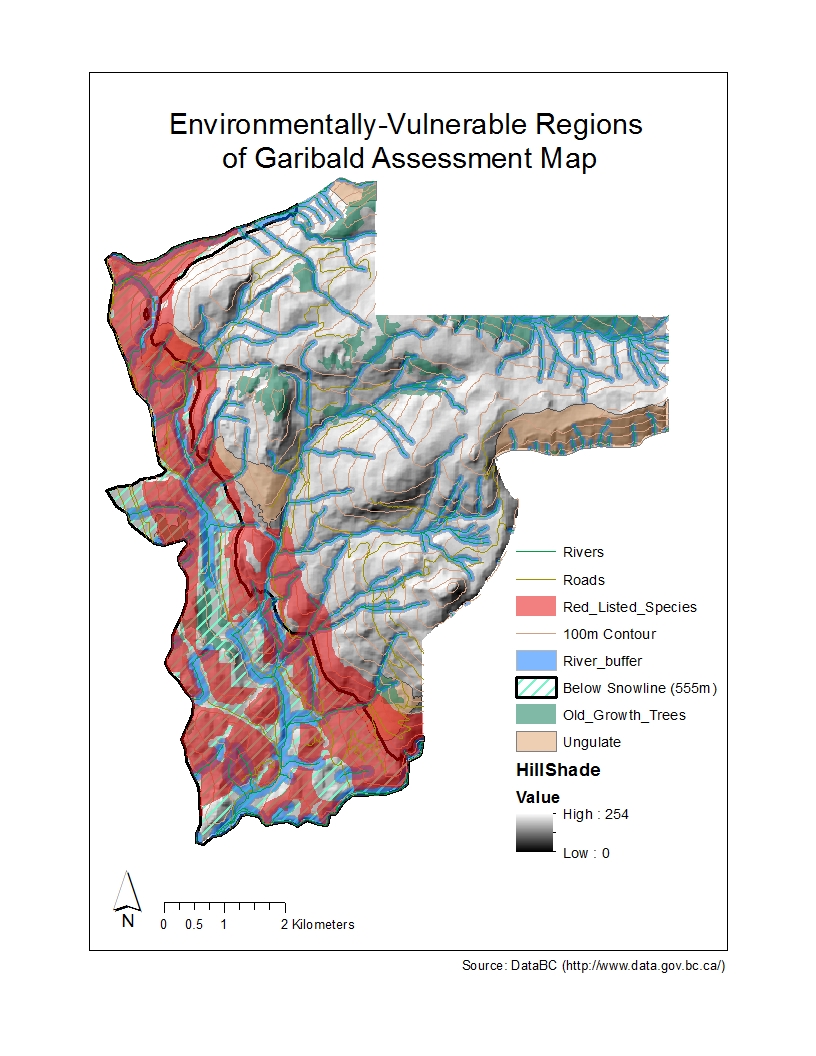
I collected the data of rivers, roads, terrestrial ecosystems, old growth trees, ungulate, and elevation from the statistic Canada website. By creating a geodatabase, I put all the datasets pertinent to the study as mentioned above. This helped organize and manage the information through all my layers. Once my relevant layers are imported into the ArcGIS, I cut my data to fit the study region since my focus is this ski resort’s local impact. I applied different tools to represent the data that I believe is important in respect of environmental protection: red-list species of all terrestrial creatures inside the site boundaries; old growth forests in this region; ungulate’s winter activity regions; areas below the snow-line (555m), which is not suitable for development of the ski routes for its low-depth snow cover; varying stream buffer zones (100m adjacent the river below the snowline; 50m above the snowline) that vary due to the different amount of fish habitats in different elevations: more fish activities below the snow-line and less above. Finally, the sum of all the areas of wildlife, fish and vegetation protection areas was calculated; I improve the basic representation to make the map clearer and more visually engaging.


  • General Results

In my analysis, I find about 53% area of the total project area is environmentally sensitive and should be under protection.

The respective areas should be under protection are illustrated in detail below:

Old growth forest: 6.8%

Ungulate (Mule Deer and Mountain Goat): 7.9%

Red-listed species: 24.8%

River buffer (for fish bear stream and riparian ecosystem protection): 26%

Furthermore, 30% area is below the snowline and does not have enough snowfall for the ski development.

  • Environmental Concerns

In my opinion, the two greatest environmental concerns to this project’s development are:

  1. The development area of this site for ski resorts may overlap some wildlife habitats and other ecosystems. Once these regions are disturbed, they are extremely difficult to be restored and the associated ecosystem services are destroyed.
  2. Although human infrastructures may not overlap some wildlife ecosystems, the potential noise, air, light, etc., pollution may put animals in danger. Large animals, as urban avoiders, may be extruded by human activities from this region; small animals like mice act as urban exploiters to exploit human waste and living environment. In this case, human activities may strongly disturb with the original local special ecosystem and may have unknown and irreversible effect.
  • Mitigation ways

However, I do find that as seen in the final map produced for this study, most of the protected areas are concentrated within the region below the snowline, which has been deemed not suitable for ski routes development, as well as around the edges of the project area boundary, which links to the provincial park (not allowed for development). Meanwhile, the significant amount of existing road networks in this region serves well for the construction and the resort’s daily use, minimizing the need for new infrastructure redevelopment.

Therefore, by concentrating the new ski resort development on the above-snowline centre area of the region as well as planning buffer zones for all the sensitive habitats and promoting sustainable design, we could minimize human impacts on this region and achieve a well-balance with the original wildlife habitats. More assessments and research about the local wild species’ diet, habits, hunting regions, etc. are in need.

All in all, even though the initial environmental concerns identified by the Resort Municipality of Whistler and the BC Environmental Assessment Office are legitimate concerns that must be recognized and mediated, I recommend that pending mitigation strategy analyses the proposal for the Garibaldi at Squamish Ski Resort be approved.

  • Ethical concerns

When I firstly got the result that over half of the region are not suitable for human infrastructure development, I personally think the project should not be allowed to continue since we must acknowledge and preserve the ecosystem services other species provide to the whole biosphere. Meanwhile, humans have moral obligation to protect other species. But as an environmental planner who was hired by the project proponents, it is my responsibility to discover the positive side of the ski resort development to this region. This obligation drives me to find the pattern that most of the environmentally important regions are located below the snowline, which coincides the inappropriate regions for ski resort development. That’s to say, developing this site does not

But as an environmental planner who was hired by the project proponents, it is my responsibility to discover the positive side of the ski resort development to this region. This obligation drives me to find the pattern that most of the environmentally important regions are located below the snowline, which coincides the inappropriate regions for ski resort development. That’s to say, developing this site does not mean significant impacts to these sensitive species considering protective buffers would be constructed in the future. This experience of ethical conflict makes me aware that every coin has two sides; I may unravel evidence contradictory to my former conclusion after some efforts.

  • Learning outcomes:

I learned the 7 steps of visualizing data in this lab project and used the first 5 steps to manipulate my data representation:

  1. Acquire – obtain the data
  2. Parse – provide some structure and order for the data
  3. Filter – remove all but the data of interest
  4. Mine – apply methods to discern patterns or context (ArcGIS analysis tools)
  5. Represent – choose a basic visual model

I produced a map and make interpretations and personal opinions on a contentious development project near Squamish, BC that is currently under Environmental Assessment review to assess its potential environmental and economic impacts.

Vancouver Housing affordability Assessment


  • Q: What is affordability measuring, and why is it a better indicator of

housing affordability than housing cost alone?

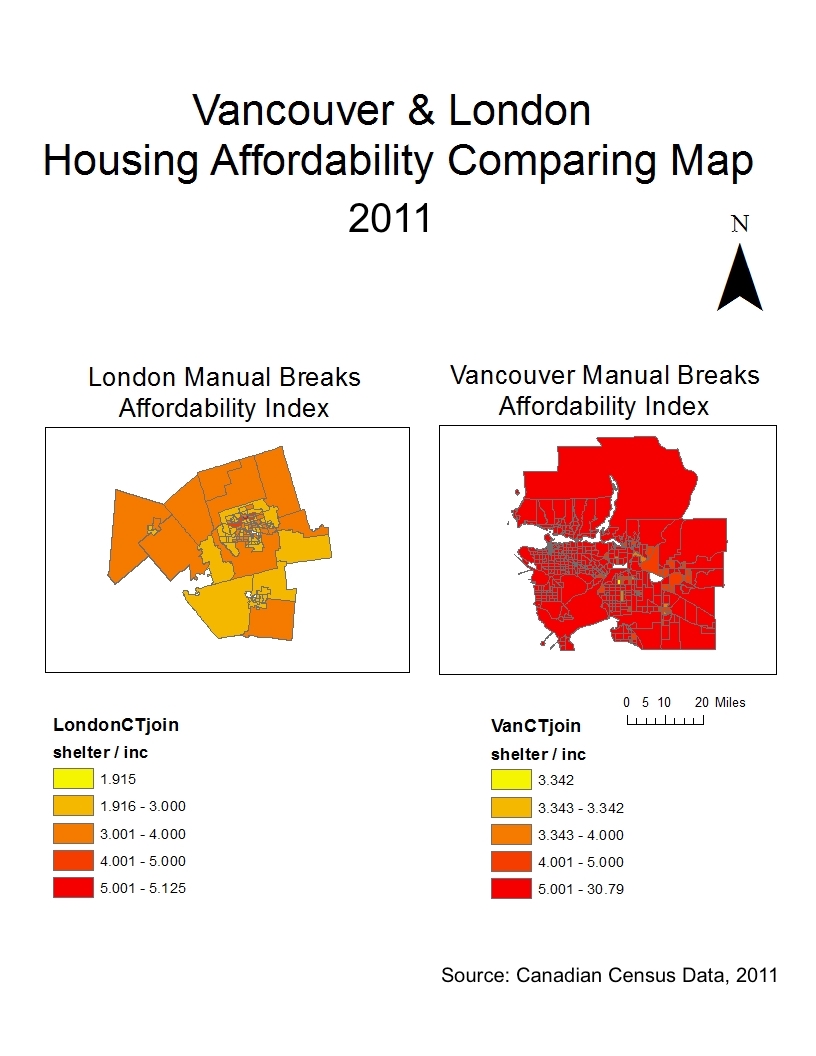
A: Housing affordability is measured in comparison to household incomes. The index is the house price-to-income ratio. Since different places in the world may have different economic levels, average salary, and living cost standards, having this indicator associated with incomes could better represent the local residents’ ability to purchase housing.

  • Q: What are the housing affordability rating categories? Who determined them and are they to be ‘trusted’? (You have seen in the previous map how different classification breaks produce very different visual impressions).

A: The rating categories are affordable (Median house price divided by median household income: 3 and under), moderately unaffordable (3-4), seriously unaffordable (4-5), severely unaffordable (5 and over). These categories are determined by the median multiple index: Median house price divided by median household income. They are to be trusted by most studies and evaluations today.

  • Q: Is affordability a good indicator of a city’s ‘livability’?

A: Since housing is the very need for all people in the world, failing to find suitable and affordable shelters would lead to numerous serious social problems such as gentrification (poor people being evicted by the rich), decreasing potential standards of living, increasing poverty rates, diminishing discretionary incomes, decreasing happiness level of citizens, etc. I see it a strange paradox that Vancouver been ranked by the NO.3 most livable city in the world but also being one of the cities with unaffordable housing in the world. Is this livability evaluated by citizens or rich foreign investors?

Lab 3

Lab3 Vancouver Tsunami Dangerous Map

Lab3 map St hospital

1. List the healthcare and educational facilities within the Vancouver danger zone, if any, and explain how you came up with your answer.

Facilities:

EMILY CARR INSTITUTE OF ART & DESIGN (ECIAD)

HENRY HUDSON ELEMENTARY

FALSE CREEK ELEMENTARY

ST ANTHONY OF PADUA

ECOLE ROSE DES VENTS

FALSE CREEK RESIDENCE

VILLA CATHAY CARE HOME

BROADWAY PENTECOSTAL LODGE

YALETOWN HOUSE SOCIETY


I used the selection by location tool to select education and healthcare layers from Vancouver danger. I then used the merge tool to merge these two layers into the same layer.

2. Provide a one or 2 sentence discussion of any potential risk to the new site for St. Paul’s Hospital.

Risk: the hospital might be flooded during the tsunami due to its low elevation. Furthermore, since it is built on a tidal flat, which has loose soil that may suffer from liquefaction during an earthquake, the hospital also may be in danger during an earthquake.


Lab 2 Portfolio post

  • Review your answers to question 2 and 5 to answer the following: for the general audience, describe how to fix misaligned and improperly referenced spatial data, including taking into consideration project properties.

Answer: We should consider if the data’s projection system is in accord with the map’s projection system or if the data or map has a projected system at all. If the projection systems are not the same, we should adjust them to the same system; if the map or the data has no projected system but a coordinate system, we should use a projected system to align the map and data.

  • Review your answer to question 10 and discuss the advantages to using remotely sensed Landsat data for geographic analysis.

Advantages:

– Remotely sensed Landsat data can reveal the whole picture of the selected study area.

– It can also document the changing of the landscape for future compare and contrast.

– Landsat data can be documented as raster images, which can be manipulated in ArcGIS to add more information (height, vegetation, slope, etc.) on.