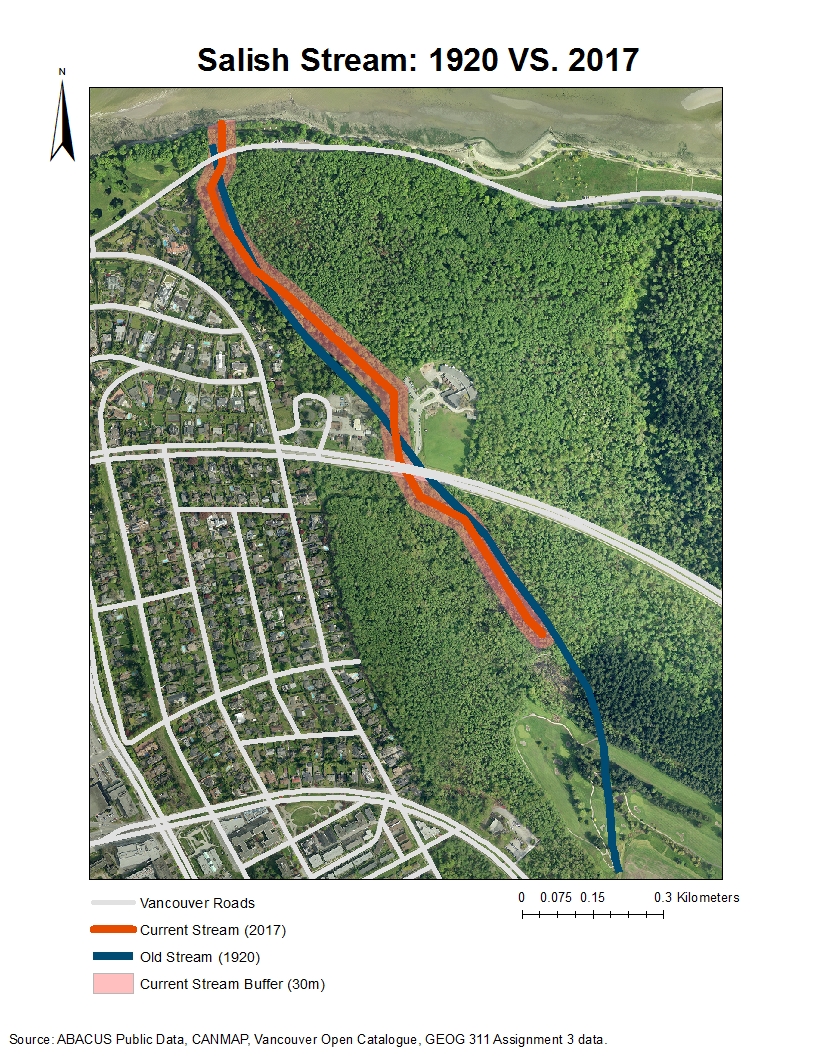
I finished this final project with my other three groupmates: Mingjia, Jackson, and Yixiao. We are interested in the lost streams of Vancouver as seen in the comparison of the map of Vancouver’s streams in 1920 and today’s stream distribution map. We visualized the astonishing number of lost streams by using ArcGIS.
Here are the four maps we made for our final project:


Considering the numerous ecological services these streams may provide to our city, preserving the existing streams and restoring the lost streams should be evaluated by all stakeholders. We believe that the maps above are constructive to further research about identifying the reasons behind the disappearance of Vancouver’s old streams and access future restoration’s practicality. We obtained the Vancouver old stream (1920) data, the Vancouver current road data, the current Vancouver stream data, the Vancouver DEM data, and the Vancouver Zoning labels, to visualize Vancouver’s lost stream’s current states.
I acted as our group’s organizer, striving to assign tasks to everyone efficiently and to keep everyone informed and prepared. We have set up a Google Drive folder to share all the information we find useful for our project, such as scholar articles we find informative for the ecosystem services provided by urban streams, the map and management standards of the Pacific Spirit Park, which is the management department of our case study’s stream, Salish stream, etc. We made the map in the lab collectively, while Jackson documenting our steps of query, using ArcGIS tools, etc., to make the flow chart effectively. I further revised the flow chart before submission. As for the written report, I divided the whole report into several sections for every groupmate to choose. The final division is that I was responsible the report’s outline, the report’s introduction of project, data, and research region, and the case study of Salish Stream; Jackson wrote the report’s error and uncertainty and further research; Mingjia was writing the abstract and methodology of analysis; Yixiao did the discussion of road distribution and the zoning part’s connection with the disappearance of rivers.
The most challenging part for me, as the group’s organizer, is to keep everyone in time for finishing their assigned tasks. Since the whole report was divided among different people, I wish that we could write individual parts in a row to keep the essay’s different sections fluent and comprehensive. However, although we contacted using Wechat, a few group mates of mine were procrastinating and therefore people who should write the following parts were stuck. As the organizer, I find this very stressful in respect of this project’s imminent deadline. I revised the final report and finally luckily and proudly finished the report with all my groupmates.
Besides the difficulty of organizing the division of the report, we also faced some problems at the beginning of the data searching. We easily acquired the data of the old streams of Vancouver from UBC library online. However, we were frustrated by the scarcity of Vancouver streams’ publicly accessible data online. We did find the current river data of Vancouver from Data BC, but this data is restricted and as students, we had no access to obtain it. We were so desperate and even considering changing the topic. Luckily, I suddenly recalled that I have seen a Google Earth kmz file from my GEOG 311 course of the distribution of the current streams in the City of Vancouver. I asked Dr. Christen, the professor of my GEOG 311 course about the source of this kmz file and found out that he digitized the map according to a picture. Since this is the only data we can make use of, I acquired Dr. Christen’s concent of using this data; we successfully transfer the kmz to shp file together using ArcGIS and conducted the further analysis.
All in all, I enjoyed the process of making maps, analyzing, and researching with my groupmates. We were proud of the final maps and report we made.
- Individual Professional Development
I learn best when I am fascinated by the employment and potential effect of my knowledge. For example, my first time seeing the practicality and efficiency of map making by the example of John Snow, who identified the source of Cholera by making the map of pumps and patients.
I learn that ArcGIS as an application and a tool could systematically exhibit all my knowledge learn from other courses such as environmental vulnerability assessment, potential hazard assessment, etc.
One thing surprised me about GIS is its connectivity to other programming languages such as R and Python. Although this is not the content of GEOB 270, I was informed by this course the significance of being able to utilize the programming languages.
My proudest highlight is by making the final project’s maps, I find that I am capable of using ArcGIS alone. I’ve already acquired the basic analysis function of ArcGIS, which makes very excited for my future application of this skill if I’ve gained more geographical knowledge in the following years.
Here is a link to our final report.