In Task #9, we were asked to review and analyze a network database in Palladio, generated from the Golden Record Curation Quiz we submitted in Task #8.
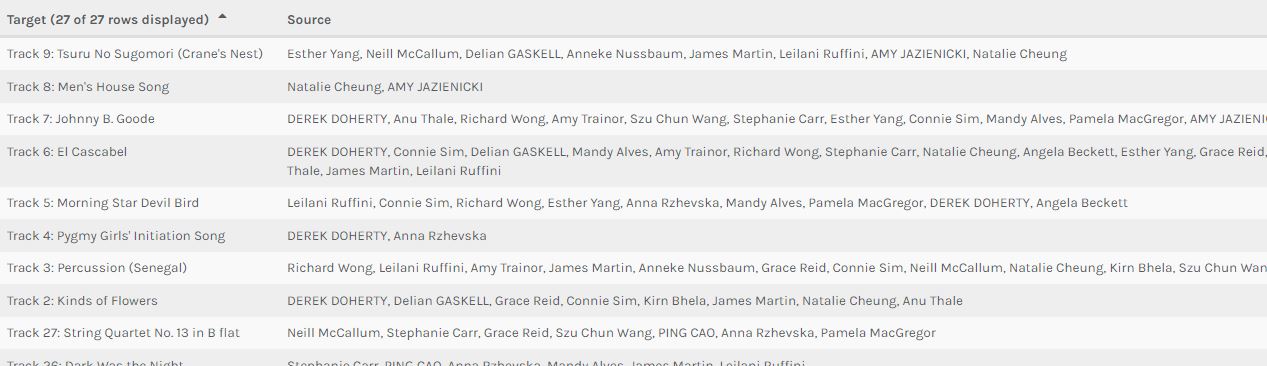
Upon loading the file, a data visualization of communities, tracks, and curators appeared. The initial image was overwhelming and difficult to interpret. However, after a few instruction manuals and a YouTube tutorial or two, I gathered that the central nodes showed some of the tracks that united our entire class. Melancholy Blues, Johnny B. Goode, the Fifth Symphony (First Movement), and El Cascabel were just a few of the tracks that appeared to connect most people in the class. Some of the tracks that appeared on the outer edge were ones that people rarely selected (such as the Men’s House Song and the Pygmy Girls’ Initiation Song).
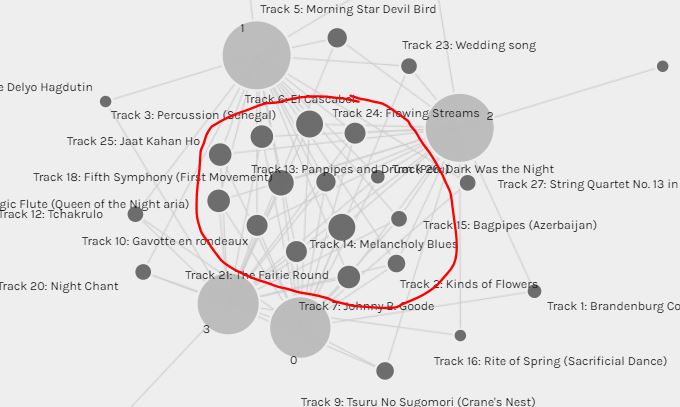
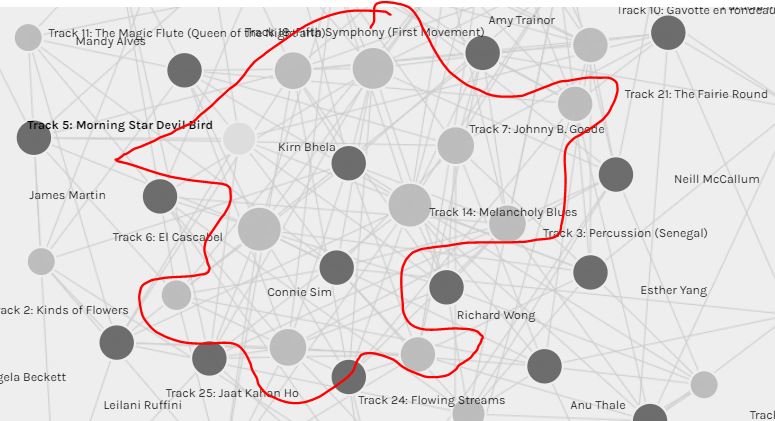
Based on this initial view, I attempted to draw some assumptions on why my classmates selected these songs, but nothing became evident came to me.
I then decided to shift my attention to the 4 communities that were populated. I was a part of Community #1 and it was interesting to once again try and speculate why we were organized in this way.
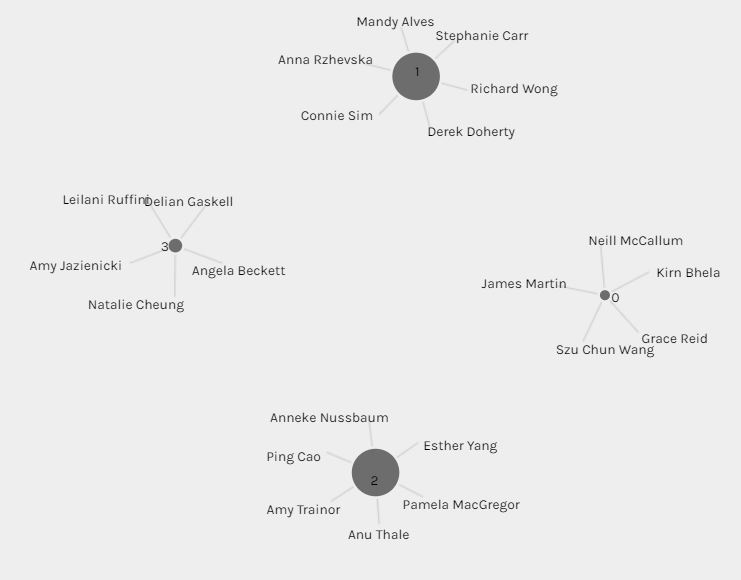
After a few more clicks, I was able to see some of the commonalities in my community (Community #1).
In the community that I was a part of, the most popular tracks were:
- Track 12: Tchakrulo
- Track 18: Fifth Symphony (First Movement)
- Track 5: Morning Star Devil Bird
- Track 6: El Cascabel
- Track 7: Johnny B. Goode
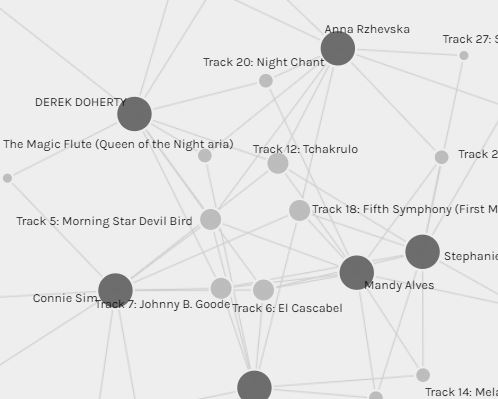
I once again found it difficult to draw a clear conclusion or assumption as to why we all chose these tracks.
I chose a lot of the tracks that I did out of diversity. To me, diversity is obtained by showing variety in gender (having male and female artists), geography (having songs from each continent and a variety of countries), genres (having folk songs, rock songs, jazz songs, etc.), and instruments (not just all guitar-based songs, but others as well). My playlist features vocal tracks, instrumentals (no vocals), male voices, and female voices. My playlist has songs from every continent (except Antarctica), thus demonstrating geographic diversity. Lastly, my songs feature a variety of genres and instruments. I have everything from Mexican mariachi to American rock to Peruvian panpipes to Azerbaijian bagpipes.
I tried to see if my group was aiming for the same approach. However, without additional criteria to sort and filter by, it was hard to draw any solid conclusions or assumptions. For example, we all chose Track 18: Fifth Symphony (First Movement). There were several classical songs, so why was this one chosen? I chose it because it was the most familiar of the classical selections. However, I am unclear whether other people chose it for the same reason.
The data visualization, on its own, does a poor job of explaining the reasoning behind the choices. Only weak inferences and speculations can be made. Additional filtering criteria such as country of origin, continent of origin, instruments used, presence of vocals, genre, or time period may have helped in drawing better inferences or conclusions.
Closing Thoughts
Overall, I found this task to be challenging as I was not completely familiar with the various terms in Palladio (such as facets and dimensions). I found that it took a lot of trial-and-error to figure out how to create the data visualization or table I desired.
For example, even after an hour of playing with it, I could not figure out how to create a table that summed up the number of students who chose a particular track. Instead, I relied on creating a table with the curators who chose each track and manually counting the number of people that appeared.
I also found it challenging to not be able to download or find the raw data. I use learning analytics in my courses and data analytics software like Tableau and Alteryx in my corporate job. With the raw data in Excel and a few additional criteria to sort on (such as instruments, country of origin, etc.), I could’ve likely come up with a more useful data visualization or made more tangible conclusions of the data.
Lastly, I found it challenging to have such little data or information to work with. If the quiz had collected reasons for selecting a particular track (even if it was broad categories like time period, vocals, etc.), I could’ve drawn further inferences from the information. In addition, I feel that I know very little about my classmates. This knowledge could’ve helped me draw conclusions and inferences about their choices. Are they from the same age group? How does their taste in music differ?
It makes me wonder whether this is how marketers determine and define target markets. Do marketers plot us all out in a data visualization and determine what features unite us?
Like you, Richard, I spent a lot of time trying to create a table with the concrete data that ranked the songs based on choices. I also had to settle on the chart listing curators after each song and count them myself. I got close with a data sort image where the size of the nodes (songs) varied based on their popularity. I found it useful for identifying the most popular songs, but it really wasn’t specific enough for me. It is similar to the first image you posted, but very different as I am in another section of this course so was analyzing a different data set.
Another aspect that I noted was that my class did not entirely eliminate any one song. I had mentally predicted that there would be more overlap in what we REMOVED from the list, as seventeen of the 27 songs had to be pulled. In fact, no song received less than four votes, so it is clear that we all set very different parameters for our choices. Like you, I also wished for this information and I suspect it is the type of data that might be most valuable from a marketing standpoint.
Thank you for this thoughtful posting. I find myself more interested in the analytics after reading about your experiences with other programs.