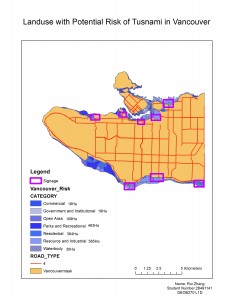
- Review your answers to question 2 and 5 to answer the following: for general audience, describe how to fix misaligned and improperly referenced spatial data, including taking into consideration project properties.
- Review your answer to question 11 and discuss the advantages to using remotely sensed Landsat data for geographic analysis.
Accomplishment Statement:
(1)To fix misaligned and improperly referenced spatial data, we preview the data and examine their attributes to check their coordinate system, projects, datum and units of measurement. If the data have different projection, we need to change them to unify.
(2)The landuse data will be useful in water resource management. I will focus on the Yellow River in China, which is the sixth-longest river in the world. The Yellow River flows across Shandong,
Henan, Shanxi, Ningxia, Inner Mongolia, Gansu and Qinghai province. I will focus on the channel in Shandong and research annual estimation of evapotranspiration from irrigated areas for monitoring of agricultural water use, annual estimation of evapotranspiration from riparian vegetation for monitoring water use and the estimation of evaporation from the channel and reservoirs of the lower Yellow River and evaporation from canals, lakes, lagoons, and other open water areas. I will choose 14 day intervals in spring, since 1972 because most Chinese farmers sow the seeds and irrigate in the spring. This will show the use of water in the agriculture and vegetation better.
The advantages to using remotely sensed Landsat data: This landsat data is free for public to use, it can be used widely for geographers and environmentalists. This will promote the research for academic achievements.
