The goal of our final project was to analyze the amount of agricultural land in the Central Coast area. British Columbia’s Agricultural Land Reserve (ALR) has been cited as one of the best examples of agricultural land preservation in the world and is considered by many as a pillar of regional food security in B.C. The ALR is a provincial land use zone wherein agriculture is recognized as the priority use for approximately 4.6% of the land base of British Columbia, Canada. Even though Central Coast is close to the Pacific Ocean, there is a limited agricultural land reserve for using. To analyze this project, we have constituted a group for 4 people and we also allocate jobs well. I am responsible for the map making, another member, Ziyu, he is responsible for the data collecting. Ji and Tina are responsible for the final report. Actually, even though the map making is my duty, I really thanks to all my members. When I have difficulty to make the slop of our study area or input the census data which downloading from the website. My members try to help me and arrange their time to meet with me. Also I want to say thank you to other groups and my TA, Eva, when I ask them questions, they are all friendly and patient. Through this final project, I have learned some interesting things. First, through our final analysis, we find that there are only almost 3200 people living in Central Coast. In addition, among these people, there are a few people whose age is between 20 to 45. This means that population is a limited for Central Coast area to develop the agriculture. Thus, if government can increase more immigrants for here, the agriculture will be promoted. Secondly, through this project, I know how to calculate the slope and how to save to the final shapefile. I believe that these skills will be helpful for me when I continue to take Geob 370. Thirdly, when Ziyu tried to find the data, some are difficult for the public. For example, the landcover data has lots of columns, if we do not use a reading related to these number. We cannot know what these are. Also it is difficult for us to find the census data for Bella Cola, which is the largest town in the Central Coast area. We just can find the number but not data resource in Chass website for GIS analysis. As a whole, we are a good team, everyone spends lots of time and effort on it. Also this course is an interesting course, we have learned lots of GIS skills through this course. For me, who wants to take jobs about GIS works, this is a wonderful semester.
Author Archives: rui zhang
Lab5: Environmental Assessment
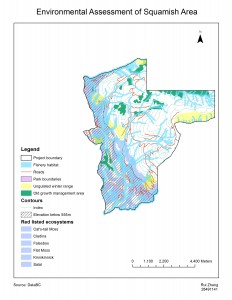
This memo is related an environmental assessment of the Garibaldi at
Squamish project. This project is a proposed year-round destination mountain resort
on Brohm Ridge, 15km north of Squamish on Highway99. In addition, this project
also includes 124 ski trails and 23 lifts, plus resort accommodation and commercial
developments. This projection will provide almost 900 construction jobs and 3000
seasonal jobs. However, this projection also makes some environmental problems.
I am a natural resource planner who has been retained by the project
proponents. I first acquire some datum of this area from DataBC, including the
project boundary, fishery habitat, roads, park boundary, ungulate winter range, old
growth management area, contours and red listed ecosystems. Then I clip these
layers to the project boundary. In addition, I reclassify the digital elevation map to
show the areas below 555m and convert this raster to a polygon. Then I calculate the
percentage of the area below 555m in total project area. It shows that there are
29.92% of areas below 555m in the project boundary. Moreover, I also calculate the
percentage of the project area with Mule Deer and Mountain Goat winter habitat,
the percentage of old growth forest in this area, and the percentage of red listed
species. Next I create a variable width buffer of protected area around the streams
by using the analysis tools command buffer in ArcGIS to calculate the percentage of
this project area will fall within fish bearing streams. To estimate the total affected
area easily, I use the overlay analysis command union to union four layers (old
growth management area, fish habitat, ungulate winter range and red listed
ecosystems).
According to my calculated result, it shows that 29.92% of project areas are
below 555m and there are 69.65% of total areas that will be affected directly. Thus,
it is clear to see that almost one third of land in the west is not suitable for ski, and
high risk to destroy the environment of this area. This project is not environmental
friendly; it can not be approved.
In my opinion, there are two greatest environmental concerns to project
development. One is the old growth forests areas; another one is the fishery habitat.
To mitigate the old growth forests areas and the fishery habitat, we can plan the ski
resort and commercial land away them to reduce the pollution and keep the original
ecological environment. In addition, to make these places more quiet, the
government can issue notice to limit people’s path to these areas and offer jobs for
manager to supervise.
Finally, related to these environmental problems, I do not suggest to continue this project.
Accomplishment Statement:
Gained knowledge to perform data visualization: search, collect, parsed, filtered, represented, and transform to spatial data to assess the environmental impact of a project.
Lab4: Housing Affordability
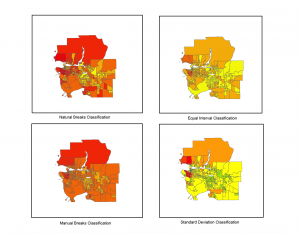
As a journalist, I will choose standard deviation because it is clear to show the difference of the mean hosing costs in Vancouver. As a real estate agent, I will choose natural breaks classification, because natural breaks classes are based on natural groupings inherent in the data and it created natural separations in the data. Also this classification is error free. This method will clearly show the areas with similar price. There are ethical implications for my choice of classification method.
Natural break classification: a method of manual data classification that seeks to partition data into classes based on natural groups in the data distribution. Natural breaks occur in the histogram at the low points of valleys. Breaks are assigned in the order of the size of the valleys, with the largest valley being assigned the first natural break.
Equal interval classification: a data classification method that divides a set of attribute values into groups that contain an equal range of values.
Manual break classification: this classification based on natural breaks which adjusts break values along natural grouping of data.
Standard deviation classification: a data classification method that finds the mean value, then places class breaks above and below the mean at intervals of either .25, .5, or 1 standard deviation until all the data values are contained within the classes. Values that are beyond three standard deviations from the mean are aggregated into two classes, greater than three standard deviations above the mean and less than three standard deviations below the mean.
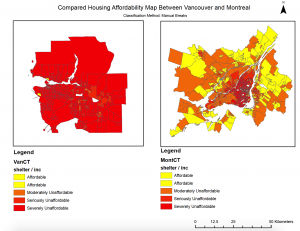
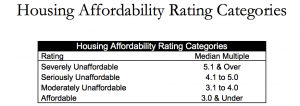
Affordability measure is to show that how many people can afford the housing cost. The housing affordability is a better indicator than housing cost because this measure include the population not only the house.
Dr. Sblomo Angel determine this theme and this is trusted.
From my point, this is a good indicator of city’s livability.
Accomplishment Statement:
Gained knowledge in searching, downloading and inputing spatial and tabular data to GIS software for the analysis on housing affordability in Vancouver and Montreal.
Accomplishment Statement of Lab2
- Review your answers to question 2 and 5 to answer the following: for general audience, describe how to fix misaligned and improperly referenced spatial data, including taking into consideration project properties.
- Review your answer to question 11 and discuss the advantages to using remotely sensed Landsat data for geographic analysis.
Accomplishment Statement:
(1)To fix misaligned and improperly referenced spatial data, we preview the data and examine their attributes to check their coordinate system, projects, datum and units of measurement. If the data have different projection, we need to change them to unify.
(2)The landuse data will be useful in water resource management. I will focus on the Yellow River in China, which is the sixth-longest river in the world. The Yellow River flows across Shandong,
Henan, Shanxi, Ningxia, Inner Mongolia, Gansu and Qinghai province. I will focus on the channel in Shandong and research annual estimation of evapotranspiration from irrigated areas for monitoring of agricultural water use, annual estimation of evapotranspiration from riparian vegetation for monitoring water use and the estimation of evaporation from the channel and reservoirs of the lower Yellow River and evaporation from canals, lakes, lagoons, and other open water areas. I will choose 14 day intervals in spring, since 1972 because most Chinese farmers sow the seeds and irrigate in the spring. This will show the use of water in the agriculture and vegetation better.
The advantages to using remotely sensed Landsat data: This landsat data is free for public to use, it can be used widely for geographers and environmentalists. This will promote the research for academic achievements.
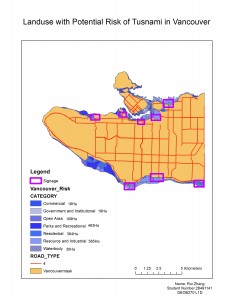
Landuse with potential risk of tsunami in Vancouver
QUESTION:What percentage of the City of Vancouver’s total area is in danger? Explain what method you used.
The total area in danger: 1587.653272 Ha
The total area of Vancouver: 13102.060002 Ha
1587.653272/13102.060002=12.1%
QUESTION :By using the appropriate selection method, create a layer containing the health care and educational facilities within the City of Vancouver danger zone. List the resulting facilities, if any. Check your results visibly. Explain how you came up with your answer.
Health care facilities in danger: VILLA CATHAY CARE HOME, FALSE CREEK RESIDENCE, BOARDWAY PENTECOSTALLODGE, YALETOWN HOUSE SOCIETY
Educational facilities in danger: EMILY CARR INSTITUTE OF ARE & DESIGN, HENRY HUDSON ELEMENTARY, ST ANTHONY OF PADUA, ECOLE ROSE DES VENTS
Use select by location. Select form “Vancouver_health” and “Vancouver_education”. Source layer “Vancouver_danger”. Export the selected data as “danger_health” and “danger_education”. Check the attribute table of the exported layers.
Accomplishment Statement:Using ArcGIS software and spatial and tabular data of Vancouver area, I make a map about the risk of tsunami in Vancouver. Through this map, we can clearly see the high-risk areas if a tsunami impacts Vancouver.
Hello world!
Welcome to UBC Blogs. This is your first post. Edit or delete it, then start blogging!
