In-class exercise

Assignment 11


The University of British Columbia, School of Architecture and Landscape Architecture
In-class exercise
Assignment 11
In-class exercise

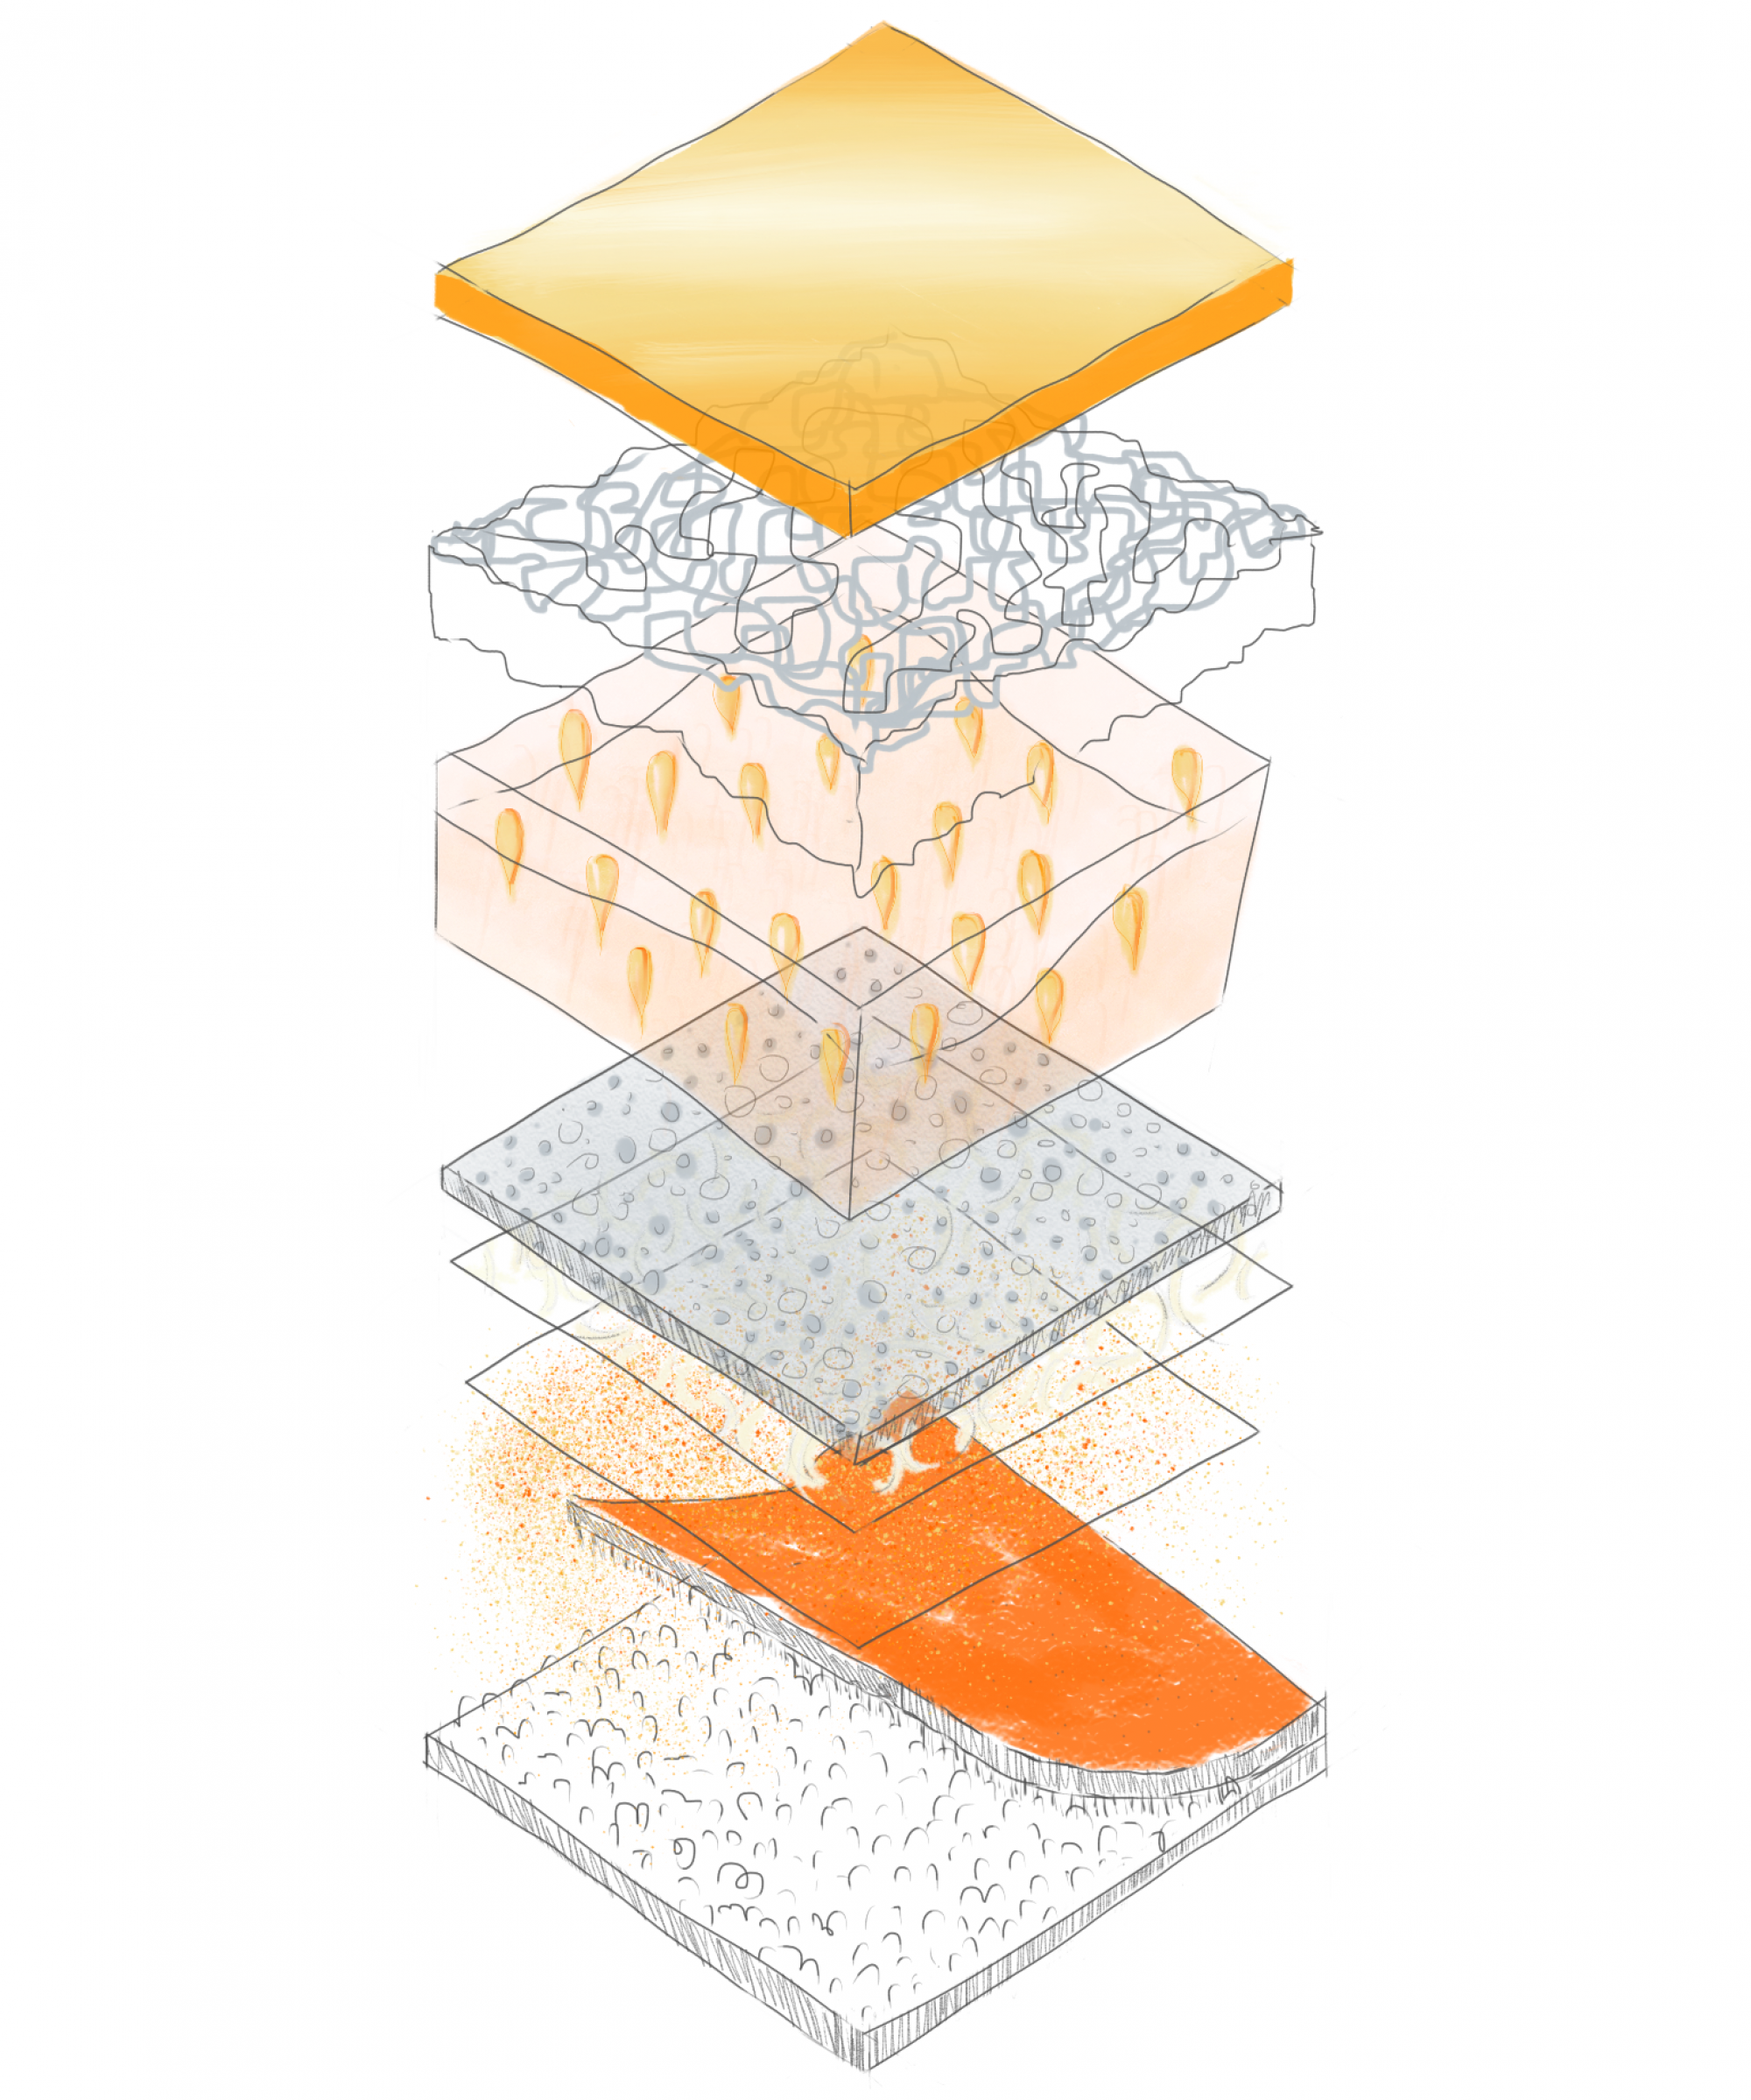
Comparison between two types of chocolate

The melting process
Assignment 10
Taste rave

Vegetables and fruits that have similar appearance: round and red.

They are actually different in composition of colours, crispiness, sourness and amount of juice.
Drinking object

The glass has two layers. The outer layer is filled with coloured liquid that resembles the drink inside. The layer is sealed so the liquid would always stay in the glass. It can be iced before pouring the drink in. Even though the glass looks big from outside, the volume for drinks is about half of the total volume. The weight and flow of the coloured liquid will make the drinking experience more realistic. It will give an illusion of the glass is full of juice.
In class exercise


I wanted to create a language system to describe smells. I did research on the primary odours that people can smell and differentiate easily. I disagreed to some of the descriptive words so I changed them. Just like a clock, the hour hand points the dominant odour and the minute hand points to the minor odour. This is a rough version of the smell clock. There could be more obvious smells and a second hand on the clock. The reason for creating this clock-like system is that odours are often complicated because there are a mix of different smells. This system tells the strong and weak smells. Also, the smell description is clear and accurate. For example, the smell could be ‘really fruity’, ‘minty-fruity’ or ‘fruity-floral’.
Assignment 9


Back alleys are always associated with bad smells. I wanted to visualize what brings that bad smell and how strong the smells are. I highlighted the sources of smell. The dispersed wave shows the intensity of the smell from each source. Some strong smells are garbage bins, carbon dioxide from the vehicle, and the general moist/moldy smell at the alley. It is interesting to find that the smell of vehicle is stronger than chemical smell from the new building in construction, and it diffuses to a long distance
In class exercise

When I was standing at my backyard, I heard three types of sound: wind chime, neighbor talking, and noise in the atmosphere. I labelled their relationship as I am inside the cube. Then I recorded their frequency and duration in the diagram above.
Assignment 8
Tuning

I chose to use a more abstract drawing to visualize the sound experience for this assignment. I was standing outside of my house with my eyes closed. I hear and I imagine. This drawing is how I felt at that moment. I forgot about the physical world and I would imagine I am standing in the darkness. It was chilly outside. I heard dry leaves jumping on the ground. I heard a bus and a bird in far. There was a hammer or some smashes that was not loud but unpleasant. And these sounds were wrapped by a wave of noise in the atmosphere. I was in the center of a tornado. I felt insignificant and weak compared to that noise. I felt like I was standing on a wire. The noise seemed like holding me in balance on a wire, but it was actually pulling and pushing me in all directions.
Windplay

I made three pinwheels with three types of paper material: regular printing paper, flyer, tracing paper. They have different weights so I want to compare their movements in the wind.
It was not windy outside so I just blew them……
In class exercise

I drew the stairs in my house for this in class exercise, trying to show the dynamic experience when walking upstairs. For example, how my feet land on the next step and how my hand can easily hold the handrail. Also, I tried to show the dimension of the staircase according to body dimension. There are 8 steps in a row, and the width can fit 2 people. If I show that I feel somewhat tired when I finish the stairs, it tells that the design of the stairs has some problems (or it’s me). Perhaps the step is too steep, or too many steps before a landing, or the landing is too short for me to rest.


I added these photos to support my drawing because I can’t illustrate the materials very well in a quick sketch.
Assignment
To continue with the stairs exercise in class, I have done this animation to show my movement. Notice that I need to use the handrail at the upper half of the stairs when I start to feel tired. The afterimages help show the movement speed too. I could have shown my leg movement smoother by drawing more action details.

This is static version of the animation. I think this still presents the movement quite well when I can all the actions at once. And the transparency of the afterimages still tells me that I am going upstairs.
Still images:


In class exercise

I mapped my route in my house with special attention to how my bare feet feel. It was my feet’s journey, so I only showed where my feet had stepped on and minimized other parts of my house. I started when my feet were on a soft footrest on top of a carpet. Then my feet could feel the different floor surface materials and temperatures. My bed was cold after a long day and I jumped to feel the softness. When I walked out of my room, my feet suddenly feel the heat delivered through the marble tile.
Assignment 6
For this assignment, I explored the temperature strategy that I used in class. I drew the objects on my desk.


Physical temperature – See by hands
Red represents higher temperature and blue represents lower temperature. I touched every object on my desk to feel the temperature. The running laptop and monitor, as well as food and water are warm. I just held my phone and mouse so they are slightly warm too.

Visual temperature – See by eyes
Thinking about colours, materials, size and patterns, visually attractive objects have higher temperature (in red) that means higher chance of my eyes looking at them. My eyes would tend to notice dark, dense pattern, hard surface/edges, and big/obvious objects. My desk is white which is strongly contrasting with dark objects. I would argue that food is always the most visually attractive than other objects on my desk.

Emotional temperature – See by the heart?
This is how I see the objects on my desk with my internal feelings. Technologies seem cold as they are not made from live or natural materials. They don’t have any human properties even though they are probably smarter than me. Objects that have higher emotional temperature are associated with comfort, memory, culture, warmth, softness, and positive energy.
In class exercise

Leather card holder
Assignment
I drew three random items blind-folded. Then I annotated and analyzed them without blinds.

The cable has the bigger end (USB) and the smaller end (Lightning). I recognized the lightning port by touching which it is rounder and smoother than my other charging cables. I know it is in a loop but I don’t know how exactly the cable is curved.

This shows the feeling of thickness, softness and weight of the cable.

The second item is a lip balm. There is a rough part at the bottom designed to be easily rotated. Without looking at the drawing, I couldn’t know where I drew the lines. But I guess the lines communicate the rotating motion by accident. When I rotate it, it feels like I am pushing it out.

This is the balm or ointment surface.

The third item is a lock. The lock makes sounds even with little movements. When I was blind-folded, I was sensitive to sounds. Again, the “rotating passwords” part is drawn out of the place.

I couldn’t feel the difference between materials by touching, but I felt the different textures of the same material. Because I couldn’t see or feel the numbers, I couldn’t unlock it.
In-class exercise
Rainwater flow

Rough version

Refined version

Block scale plan
Assignment 4
Sir James Douglas Elementary School

Base Plan

Green vs grey analysis

Green vs Grey + Program analysis

Green vs Grey + Program + Circulation analysis

Vegetation type analysis

Rainwater flow analysis

Long section showing scale of building in relation to adjacent landscape

Section showing relationship between building and road, also underground utilities

Ground level perspective showing materials and use of space

Axonometric showing the experience of the road, sidewalk, and the entrance.
The Fraserview Park

Numbers indicate the order of people entering the site and their starting point. The central gravel path was frequently used. People were walking or running in loops. One exception was the dog and the owner cut straight into the lawn. The play area was very popular as well. Parents and children were playing and walking around a lot in that area. The park is situated between the street (with the bus stop) and residential area. Few pedestrians walking from the street would take the alleyways instead of walking into the park.

When the kid jumped off the swing and ran away, the swing was still moving. This map shows the movements of both the kid and the swing. Woodchips are under the swing set.

This map shows the distribution of gravels in a more conceptual way. It could be the map of how gravels travel throughout the site and reach the points at park: benches and fitness equipment. The gravels mainly stay at the pathway but they are also found scattered at the lawn and other areas. It is assumed that as the park is commonly used over the years, the gravels are moved by every step of people or animals.

The sky was separated by several colours at 19:23 when the sun was just set. The front ground was completely dark which I could only see the shapes of trees and houses.
In class exercise


Practice drawing cubes

Practice drawing other basic shapes

A wireless mouse

Understanding the space
