Uncategorized

Stopping Early Child Marriage

Child Marriage around the world

Each year around the world, 15 million girls are married before the age of 18; these girls are married off too early.

On December 19, 2011, United National General Assembly adopted Resolution 66/170 to declare October 11 as the International Day of the Girl Child, to recognize girls’ right and the unique challenges girls face around the world.[1]

On October 11th, 2017, the world celebrated the International Day of Girls, and Prime Minister Justin Trudeau has announced Canada’s pursuit of feminine development policy. This announcement is to advance gender equality and the empowerment of women and girls because it is the most effective way to reduce poverty and build a more inclusive, peaceful and prosperous world.[2]

Canada is working with UN agencies, and other international and regional organizations to raise awareness and take action to protect girls around the world. In 2013 and 2014, Canada and Zambia developed and passed the first-ever United Nations General Assembly resolution on early, child and forced marriage.[3]

Furthermore, in 2013 and 2015, Canada worked with other countries to develop and sponsor resolutions on eliminating this harmful practice at the Human Rights Council.[4]

In September 2015, a set of Sustainable Development Goals adopted by countries includes a target to end child, early and forced marriage, and to reach this target, Canada has engaged in 1) raising awareness about child, early and forced marriage, 2) investing in projects that prevent the practice and to support girls and women who are already married and, 3) building partnership to ensure that we fully implement the 2030 Agenda.[5]

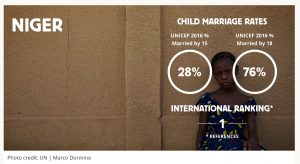
The child marriage in the rural area of Niger, as the rate of child marriage is predominant.

The link between education and the prevalence of child marriage is particularly evident in Niger: 81% of women aged 20-24 with no education and 63% with only primary education were married or in union at age 18, compared to only 17% of women with secondary education or higher. Among these number, 36 percent of girls are married before 15.

First of all, Global Affairs Canada must have more ties with local organizations present in the rural area of Niger. More interaction with local staffs in organizations such as World Vision, Red Cross, or even religious organizations will facilitate interaction with parents and children from the poorer families. Interaction with parents and children will be effective in reducing the number of child marriage.


[1] UN, International Day of Child, www.un.org/en/events/girlchild/background.shtml, Accessed 19 Oct, 2017

[2] Justin Trudeau, Prime Minister of Canada, http://pm.gc.ca/eng/news/2017/10/11/statement-prime-minister-international-day-girl, accessed 19 Oct, 2017

[3] Government of Canada, http://international.gc.ca/world-monde/issues_development-enjeux_developpement/human_rights-droits_homme/child_marriage-mariages_enfants.aspx?lang=eng, accessed 19 Oct, 2017

[4] Ibid

[5] Government of Canada, http://international.gc.ca/world-monde/issues_development-enjeux_developpement/human_rights-droits_homme/child_marriage-mariages_enfants.aspx?lang=eng, accessed 19 Oct, 2017

Should we privatize primary education?

Is primary education a public good?  

Today, in this blog I am going to talk about whether we should privatize the primary education in Canada.

First of all, let’s examine what public good is.

In economics a public good is defined as a good that is both non-rivalrous and non-excludable, meaning that the consumption of a designated good by one individual does not reduce availability to others, and does not exclude others from using it.

In my opinion, in Canada, the primary education is commonly known as a ‘close to being Public Good’, meaning not 100% public. Therefore, primary education is considered as a mixed public good because primary education is rivalrous to some degree and non-excludable.

How is primary education managed in Canada?

In Canada, public education is provided to all Canadians who meet various age and residence requirements for free. The ages for obligatory schooling vary from one jurisdiction to another, but most require attendance in school from age 6 to 16.

Education is almost entirely decentralized to the provinces and territories who are responsible for the provision, funding, and regulation of education. Each provincial and territorial ministry or department of education determines curriculum standards, education financing, teacher education, assessment, and other related issues. According to Statistics Canada, the total nominal spending on elementary and secondary education in government schools was $69.9 billion in 2015-16.

Although the public benefits from free primary and secondary education, there are few challenges. The challenge in public provision for primary education is the quality of education provided by the teachers. Because public school classrooms are overcrowded, the time spent to each individual student is limited and is difficult to monitor and evaluate the performance of the teachers.

Furthermore, because public schools have limited public funds, they are restricted in their program development or curricula. Public schools have less freedom in developing their own curricula and in some circumstances are too much dependent on government interference.

What if primary schools were privatized?

In most private schools, classroom size is much smaller, which allow teachers to give attention to each individual student. Private schools also are not restricted in their program development or curricula. Furthermore, private schools are not subject to the budget limitation imposed by the state, and therefore have a freedom to develop their own curricula.

Funding wise, the legislation and practices concerning the establishment of separate educational systems and private educational institutions vary from jurisdiction to jurisdiction.

If of $69.9 billion, only $4.4 billion was spent for private education in 2014-15, this means, the parents cover the tuition fees, which normally cost around $4,000 to $100,000 annually. Therefore, if education privatized, parents will have to put on with it.

Moreover, private institution have selective enrolment as they have the authority refuse the admission of certain students, whereas public schools allow all students, regardless of any factors. Selective admission creates a culture that has the potential to redefine the very nature of education.

Private or Public?

The privatization of education creates a range of ethical, political and educational problem that cannot be disregarded. According to the UNESCO report, privatization policies in education are predicated on the assumptions of economic self-interest (corruption) and generate unsustainable patterns of social inequality.

Nevertheless, the global trend towards privatization of education also implies the case of Canada. It is true that the idea that education should be funded and managed entirely by the state is no longer feasible, especially in an era of expanding demand for education. However, privatizing it entirely is putting too many risks in the primary education.

In line with this, the Public-Private-Partnership (PPP) for primary public education is the best way to provide transparent and equal education to all citizens. Through PPP, State will work together with private sectors to develop policies programs, where State provides the fund while the private sector brings access to finance, knowledge of technologies, managerial efficiency and entrepreneurial spirit. This way, State will be able to control the excesses negative output created through privatized education and will provide fair and equal education to all.

Such a balance will not easy to achieve, and such partnerships can often be a create a conflict of interest between public and private sector, as the private sector inevitably gravitates toward activities where it is quick to make a profit, leaving the public sector with the inherently more complex and less easily rewarded task. However, the upside of it is that State has the option to opt out the private partnership when things go wrong with the private sector.


Canada Digital Diplomacy in 2017


https://www.opencanada.org/features/digital-diplomacy-how-canadian-government-faring-social-media/

Our MPPGA cohort have collected social media data on Global Affairs Canada’s Twitter and Facebook pages. After we gathered information 547 accounts that exists on two platform, we have found unexpected results.

Based on 2017, Facebook account that has the most like “ excluding the N/A data” is Buma with 401,139 total number of likes. Although not so active with only  2 posts in the last 7 days (date range: October 27th to November 2nd).

Second account that has the most number of likes is Mexico, with 237,935 likes and 13 posts in the last 7 days. The next account with the most number of likes is India with 205,502 likes and 14 posts in the last 7 days.

On the other side, the most active account is Ukraine, with 50 posts in the last 7 days, and 1,651 posts likes in the last 7 days. It is also worth mentioning that there are 3,594 post likes in the last 30 days.

The second most active Facebook accounts are Tunisia (French account), and Columbia with 28 posts in the last 7 days, but Tunisia having only 2 likes, and Colombia with 91 likes in the last 7 days.

For twitter, account that has the most number of followers based on 2017 is Voice of the World account that 488,086 followers, followed by Canada Foreign Policy account that has 74,409 number of followers. The next account that has the most number of followers is France with 34,600.

The twitter account that has an outstanding number of tweets in the last 7 days is PM of UN, having 247 tweets. The second most active twitter account is Invest in Canada (French account) having 63 tweets in the last 7 days.

Reducing greenhouse gas (GHG) emission in Canada

Canada is already expecting a significant economic costs associated with the climate impact from rising greenhouse has (GHG) emission. However, surprisingly, most provinces of Canada, including BC are not anticipating to achieving the existing emission-reductions targets for 2020. Delaying the action to reduce the emission gas will bring higher future costs for Canadians.

Canada’s total greenhouse gas emission in 2015 were 722 megatons (MT) of carbon dioxide equivalent (CO2 eq), or 18% (111 Mt CO2 eq) above the 1990 emissions of 611 Mt CO2 eq. Annual emissions steadily increased during the first 10 years of this period, fluctuated between 2000 and 2008, dropped in 2009, and gradually increased thereafter. 

Canada’s emissions growth between 1990 to 2015 was cause primarily by increased emissions from mining and upstream oil and gas production as well as transport. On the other hand, the reduction from 2005 to 2015 was primarily due to reduction of emission from public electricity and heat production utilities.

The line chart shows Canada’s national greenhouse gas emissions in megatons of carbon dioxide equivalent from 1990 to 2015.

Canada has taken its step forward to fight against climate change. One of the recognizing action Canada is undertaking is pricing carbon pollution, which is known to be the most effective, transparent, and efficient policy approaches to reduce emissions

As delaying such policy action will highly cost Canadians in the future, it is important that ALL Canadian provinces take action to reduce the GHG emission.

Here are some key facts and figures published by the Government of Canada. 

  • Jurisdictions will choose a system: they can put a direct price on carbon pollution or they can adopt a cap-and-trade system.
  • Pricing will be based on GHG emissions and applied to a common and broad set of sources to ensure effectiveness and minimize interprovincial competitiveness impacts.
  • Revenues collected stay with the province or territory of origin.
  • The provinces and territories decide how to use this money. For example, they can give it back to families, build rapid transit, or support small businesses that will innovate and create good jobs for Canadians.
  • In provinces and territories with a direct price on carbon pollution, the price will start at a minimum of $10 per tonne in 2018, rising by $10 each year to $50 per tonne in 2022.
  • The Government of Canada will provide a pricing system for provinces and territories that do not adopt one of the two systems by 2018.
  • The approach will be reviewed in 2022 to confirm the path forward. 

https://www.canada.ca/en/services/environment/weather/climatechange/climate-action/pricing-carbon-pollution.html

Increase in Minimum Wage in Canada

As the provinces of Alberta and Ontario are anticipating the increase in minimum wage by 2018 and 2019 respectively, this week I am going to talk about the increase in minimum wage in Canada and its economic impacts.

During the presidential campaign, many candidates target the minimum wage and income inequality policies towards low to middle income families, as did Barack Obama, Hilary Clinton and President Moon Jae-in, to name a few.

Many believe increase in minimum wage will bring economic growth and will lift people out of poverty. Thus, during presidential election, a few politicians target the increase in minimum wages to appeal, and actually do obtain popularity.

However, it is interesting how this economic theory splits into two outlooks. Some politicians like Justin Trudeau do not prioritize boost in minimum wage, and states that minimum wage will not reduce poverty, but rather increase.

I personally believe that increase of minimum wage that is considered as an essential anti-poverty device will not lift people out of poverty and below are my arguments.

What is the economic problem behind it?

Main reason for the Canadian governments to raise the minimum wage is to reduce poverty and income inequality of the low and middle-income people by boosting their earned income and by ameliorating their quality of life.

Moreover, the government of B.C tries to address the minimum wage policies because increasing the minimum wage of low and middle-income people could be good news to both taxpayers and recipients, as it allows the recipient to leave welfare and enables them to earn income instead of receive it in the form of transfer payment (Gunderson, 2014).

Since economic growth is highly linked with reduction of poverty, the Canadian government is looking forward to augment minimum wage.

Then what will be the impact?

There are two potential effects of minimum wages: 1) the immediately visible effect and, 2) longer-run effects, which is subtle and less visible, also called as “law of unintended consequences (Gunderson, 2014).

First is the most evident effect, which is immediately visible: the immediate increase in income, especially of students, teens, youths and other workers that are relatively not poor and often wealthy (Campolieti et al., 2012).

Second, the most important, is the longer-run effect that rather creates slightly more poverty. Raise in minimum wages perhaps reduce the employment opportunities and hours of work, and this could occur in the form of subtle slow growth of employment or hours of work in low wage jobs (Campolieti et al., 2012). For example, hiring freeze will occur, and employers will tend to replace human labour service occupation into self-service and automated systems (e.g. gas station, cafeterias, check-out counters, etc.) (Campolieti et al., 2012).

Another long-run impact of the policy could have an effect on human capital formation in forms such as training and education that can affect poverty. In other words, younger generations will restrain from working for employers that pay lower wage jobs or even unpaid internships, which is usually a stepping-stone job that enhance young people’s succeeding wage growth (Campolieti et al., 2012).

Also, according to Campolieti et al. (2012), the minimum wage policy could have an impact on education decisions. If minimum wage increases, teens and youths will choose to drop out of school and go to workplace instead. From studies, higher minimum wage will encourage students to choose high-wage job over education (Campolieti et al., 2012).

Furthermore, in the longer-run, minimum wage could have an impact on young people to obtain jobs when they first enter the labour market, and this could have a permanent scarring effects as well as restraining young people from gaining informal training and experience (Campolieti et al., 2012).

Lastly, according to Campolieti et al. (2012), with increase in minimum wage, price of goods and services consumed by lower income people will raise as consequence.

In the case of Canada, Alberta and Ontario is anticipating the increase in minimum wage by 2018 and 2019 respectively, but some rough calculations for Alberta indicates a potential loss of around 25,000 jobs (Marchand, 2016).

Moreover, according to Gunderson (2014), the Canadian evidence shows that the increase in minimum wage will have no impact in reducing poverty, but may rather exacerbate poverty slightly. 

Any recommendations?

As discussed above, minimum wages policies reflect the economic “law of unintended consequences”(Gunderson, 2014). Therefore, alternative policies should be presented in order to avoid these unintended consequences.

In my opinion, diminution of poverty should be accomplished through policies such as the Working Income Tax Benefit (WITB) in Canada (WITB is a refundable tax credit intended to provide tax relief for eligible working low-income individuals and families who are working and to encourage Canadians to enter the workforce).

As suggested by Campolieti et al. (2012), WITB policies is based on wave subsidies targeted towards the working poor, administrated through the tax system so they can be based on family need, with the subsidy reduced as income increase so as to minimize spillover benefits to those with higher income (Campolieti et al., 2012). 

Since it is the state that pay the higher wages to workers rather than employers, subsidies through such program like the WITB will be much better targeted to the working poor without adverse employment effects (Campolieti, Gunderson, & Lee, 2012).


Reducing Traffic Peak at UBC!

According to Business Insider, Vancouver was ranked 2nd worst traffic city in North America, followed by Los Angeles.

Vancouver

Congestion: 30% increase in driving time over no traffic

Morning peak: 51% increase

Evening peak: 65% increase

Los Angeles

Congestion: 33% increase in driving time over no traffic

Morning peak: 56% increase

Evening peak: 77% increase

Because Vancouver’s economy is growing, the demands on streets and sidewalks must also be increasing.

In May 2017, Vancouver became one of the first North American cities to adopt a traffic congestion plan to improve traffic flow, reduce gridlock, and keep people and goods moving efficiently across the city and region.

And the five goals supporting the new Congestion Strategy Management are:

1) Improve monitoring of traffic conditions and trends;

2) Improve road safety;

3) Ensure a smart and efficient transportation system;

4) Coordinate street use; and

5) Prioritize people and goods movement.

The Congestion Management Strategy is the latest of several initiatives Mayor Robertson and Council have adopted to improve transportation options and road conditions for all users, including:

* Moving toward Zero Traffic Fatalities

* Supporting the Mayors’ Council’s 10-Year Plan for Transit and Transportation

* A new, more efficient Parking Management System

* Transportation 2040 Plan to reduce emissions, improve health, and have a positive effect on the environment

* Launching Mobi, the City’s bike-share program last summer

UBC on its end is setting goals to be reached by 2040.

o TARGET 1: By 2040 at least two-thirds of all trips to and from UBC will be made by walking, cycling or transit and maintain at least 50% of all trips to and from the campus on public transit.

o TARGET 2: Reduce single occupant vehicle trips to and from UBC by 20% from 1997 levels and reduce single occupancy vehicle trips per person to and from UBC by 30% from 1997 levels.

o TARGET 3: Maintain daily private automobile traffic at or less than 1997 levels.

Among the goals set by UBC since 1997, some have been bringing good news, and some others the opposite.

According to the report released last year, in 2016 54% of all trips to UBC were made by sustainable travel modes and 52.5% of all trips to and from the campus were made by transit. Which is good news! Right?

If you look at the table below, we can see a tremendous increase in Transit. Since UBC has implemented a mandatory U-pass at $35 per month to students, which offers students unlimited access to TransLink Bus, SkyTrain and SeaBus services (all zones), and discounted West Coast Express fares it has seen success in reaching target 1.

However, numbers of carpool, bicycles and pedestrians are quite deceiving.

Aside from implementing the mandatory U-Pass, UBC has changed the class start times in 2001 in order to spread the transit demand in the morning peak period. Before 2001, the first classes in the morning all began at 8:30 am. After the change, some classes started at 8:00 am, some at 8:30 or 9am.

Nevertheless, if we look at the graph below, the traffic peak is rather condensed at 10 am, instead of being evenly dispersed. Traffic peak at 10 am means that students starting class at 10 am will travel in between 9 to 9:30 am.

I personally think UBC should evenly spread the class starting hours from 8 to 10 am. I myself take the transit at 9am everyday, because all of my classes start at 10 am and I am having unpleasant experiences every morning commuting to UBC.

Sometimes, buses would be full and would just pass without embarking people waiting at stops and most of the time, I would travel to UBC standing up in a crowded bus (which is a good 45 standing with heavy backpack).

Think about it. If traveling by bus is such a hassle, those who have the option to drive their own car will rather choose to drive.

The third column of table 2.1 shows that the majority of students travel either with Public Transit (73,300)or Single Occupant Vehicle (SOV) (51,300).

I mean, if UBC wants to reduce the number of SOV, then one of the change it should undertake is evenly spreading the class start hours to reduce the traffic peak at 10 am.

Real Reason why Rohingya Muslims Are Forced Out.

Background

Rohinhya are known as the world’s most persecuted minority living in Myanmar, in the region of Rakhine. They are an ethnic group, majority of whom are Muslim, who have lived for centuries in the majority Buddhist Myanmar.

After Myanmar’s independence from the British in 1948, the Union Citizenship Act was passed, defining which ethnicities could gain citizenship. The act, however, did allow those whose families had lived in Myanmar for at least two generations to apply for identity cards. Since 1970, the government of Myanmar consider them as illegal and refuse their citizenship.

Current Issue

Recently, we have seen an escalation of violence against the Rohingya in Rakhine, Only in October 2016, over 74,000 ethnic minority of Rohingya escaped from Myanmar to Bangladesh, seeking refuge. However, not much focus has been given to the humanitarian crisis and inadequate support.

Also, the State Chancellor and Nobel Peace prize laureate Aung San Suu Kyi is been criticized by the public for remaining silent about Rohingya crisis.

Why human rights and security not put into action?

Religious and ethnic differences have been widely considered the leading cause of the persecution. But it is becoming increasingly hard to believe that there are not other factors at play. Especially given that Myanmar is home to 135 official recognised ethnic groups (the Rohingya were removed from this list in 1982).

Here is an interesting article I found online, which convinced me to approach the problem with a different perspective.

Apparently, the land grabbing and confiscation is a common phenomenon in Myanmar. Since the 1990s, military juntas have been taking away the land of smallholders across the country, without any compensation and regardless of ethnicity or religious status.

Land has often been acquired for “development” projects, including military base expansions, natural resource exploitation and extraction, large agriculture projects, infrastructure and tourism. For example, in Kachin state the military confiscated more than 500 acres of villagers’ land to support extensive gold mining.

Development has forcibly displaced thousands of people – both internally and across borders with Bangladesh, India, and Thailand – or compelled them to set out by sea to Indonesia, Malaysia and Australia.

In 2011, Myanmar instituted economic and political reforms that led it to be dubbed “Asia’s final frontier” as it opened up to foreign investment. Shortly afterwards, in 2012, violent attacks escalated against the Rohingya in Rakhine state and, to a lesser extent, against the Karen. Meanwhile, the government of Myanmar established several laws relating to the management and distribution of farmland.

These moves were severely criticized for reinforcing the ability of large corporations to profit from land grabs. For instance, agribusiness multinationals such as POSCO Daewoo have eagerly entered the market, contracted by the government.

 It is also known that since 1990, Chinese companies have exploited timber, rivers and minerals in Shan State in the North of Myanmnar.

Also note that among numerous development projects in Myanmar, a transnational pipeline built by China National Petroleum Company (CNPC) connecting Sittwe, the capital of Rakhine, to Kunming, China, began operations in September 2013.

It is also known that Coastal areas of Rakhine State are clearly of strategic importance to both India and China. The government of Myanmar therefore has vested interests in clearing land to prepare for further development and to boost its already rapid economic growth.

Is this a familiar Issue?

Yes it is.

Africa is another victim of these “development projects”. Many big players in the world take advantage of the fertile land in Africa in a context of planting vegetables. In one sense they are developing the African soil but in reality, residents are expulsed to slums where permanent employment, disease, and prostitution are created naturally. Because of many governments and multinational corporations’ cross-linked situation, so called the vicious circle, many people from Africa die from hunger.

Behind the context of economic growth and development, tremendous number of people suffer, human rights taken away from them.

These multinational companies probably needed the Rakhine region for their profit and the government of Myanmar mutually agreed to free the space by confiscating and displacing residents by force.

In line with this, foreign direct investment policy must be reviewed at an international level to PROTECT victims of capitalism.

GPP509 | Policy Brief

Policy Brief #1

  • Author: WHO (World Health Organization)
  • Policy Arena: Childhood overweight / Nutrition
  • Purpose: to increase attention to, investment in, and action for a set of cost-effective interventions and policies that can help Member States and their partners prevent continued increase in overweight in children and ensure that the target is met
  • Generic table of content
    • Current children overweight situation in number
    •  Health problems related to child overweight
    •  Global target by 2025
    • Examples of interventions for reducing the risk of unhealthy weight gain in childhood
    • Actions that can drive progress in ensuring no increase in childhood obesity
    •  Suggested policy actions
  • Thoughts: This policy brief is taking childhood obesity seriously, as the number of overweight children worldwide increased from 32 million to 42 million between 2000 and 2014, especially for children under 5 years of age. This policy brief not only focuses on issues on how mothers should feed their children responsibly, but also focuses on first 1000 days of a woman’s pregnancy to her child’s second birthday. For example, WHO suggests that local community health workers or health services should provide support in the pre-pregnancy and postnatal period for exclusive breastfeeding until 2 years of age and beyond with appropriate complementary feeding, because it is seen that breastfeeding and good maternal health and nutrition had shown to reduce the risk of children becoming overweight. This policy brief implicates several platforms such as governments, NGOs, international agencies, health services and retailers that will eventually play an important role in the intervention of childhood overweight.
  • Link : http://www.who.int/nutrition/topics/globaltargets_overweight_policybrief.pdf?ua=1


Policy Brief #2

  • Author: Silke Staab, Researcher Specialist at Research and Data section (UN Women)
  • Policy Arena: Gender equality, Child Development and Job Creation
  • Purpose: To discuss different mechanism for financing, delivering and regulating ECEC (Early Childhood Education and Care) service and highlights promising avenues for realizing 3 dividend (1. Facilitating women’s labour force participation 2. Enhancing children’s capabilities and 3. Creating decent jobs in the paid care sector)
  • Generic Table of Content
    •  Summary of ECEC
    • Types of early childhood education and care services
    • Policies: option for funding and delivering ECEC services
      • The education / care divide
      • Who pays? Public funding vs. fees
      • How money should be spent? Direct investment in service delivery vs. parental subsidies
      • Who delivers and responds? State, market and community-based provision
  • Thoughts: Usually, when we talk about early child education, we often focus only on children. However, this policy brief specifically examines the implication for women, as mother and childcare workers who have a huge stake in this issue. Increasing numbers of childhood education and care services increases number of job (increases the economy), enhances children’s physical and cognitive development, and facilitates women’s labour force participation. In order to do so, government invest directly in service or provide subsidies to parents. However, in countries such as Ethiopia, Serra Leone and many of the Arab States, where funding are provision are entirely left to the private sector, ECEC coverage tends to be low, and better-off urban families benefits the most, and children from poorer families are less exposed to quality education. Therefore, in order to enhance the 3 dividend mentioned above, ECEC should entirely be left to public sector, in order to give equal opportunities to all.
  • Link: http://www.unwomen.org/-/media/headquarters/attachments/sections/library/publications/2015/unwomen-policybrief02-genderequalitychilddevelopmentandjobcreation-en.pdf?la=en&vs=713


Policy Brief #3

  • Author: OCED
  • Policy Arena: Business / Entrepreneurship
  • Purpose: Promoting innovative entrepreneurship, as number of start-up has decline in Korea.
  • Generic Table of content:
    • What is the issue?
    • Why is this important for Korea?
    • What should policy makers do?
  • Thoughts: Recently, number of start-up rates has drastically decreased in Korea, while between 2006-13, it was above the OECD average. In order to overcome the negative start-up rate, government of Korea has introduced several provision, such as “Act on support of female-owned businesses”, “Young Entrepreneurs Start-up Academy”, and many more. However, it is difficult for SMEs to grow and survive in Korean industries and that, mainly because of the low levels of innovative entrepreneurship, which is crucial to increase productivity levels in the small business sectors. Therefore, I strongly agree that 1. Improving entrepreneurship and financial education as well as mentoring and coaching, especially among women and young people, 2. Giving second chance for non-fraudulent entrepreneurs, 3. Pursuing policies to diversify financing instrument for start-ups and SMEs, 4. Focusing venture capital on start-ups by facilitating easy-stage IPOs in the KOSDAQ and KNOEX markets, 5. Taking further steps to jumpstart the M&A market and 6. Easy entry regulation, in particular in service sectors will encourage SMEs to grow in Korea.
  • Link: http://www.oecd.org/policy-briefs/korea-promoting-innovative-entrepreneurship_EN.pdf