
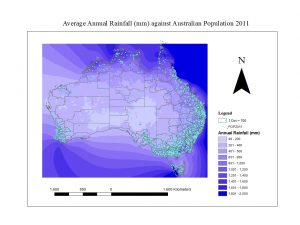
This is a map I made in my second year geography class. I remember finding this very difficult, as I am not the most technically savvy person. This was not the only graph I made, the whole class was based around statistics and how to project these findings through maps, figures, graphs.
Once I completed all of the work, I felt a feeling of satisfaction. Having compiled all of those statistics, and then created my own graphs using IT technologies, was something I would have never normally done. Despite all of this, this class also made me realise that this was not the avenue of geography I wanted to go down.