Hong Kong Transport Pricing Policies

Hong Kong is one of the most crowded places in the world. With more than 7 million citizens and thousands of tourists living in 1000 square kilometers, traffic congestion is considered a huge problem in Hong Kong’s urban development.[1] In order to solve the problem, Hong Kong government has proposed many traffic policies since 1980. Hong Kong is also the first jurisdiction to propose the Electronic Road Pricing (ERP) in the world. Interestingly, the ERP scheme is never launched in Hong Kong due to the lack of stakeholder support and the instability of policy environment during that time. Besides the ERP, Hong Kong also proposed other policies such as vehicle ownership control and vehicle use control, which were launched in terms of high tax or tolls and had achieved extraordinary success in reducing traffic congestion. I will discuss about these two policies in the following paragraphs.

1.   First Registration Tax (FRT)

Hong Kong has a highly developed public transportation system, which covers over 90% of passengers’ daily journeys.[2] Among all the public transportation, Mass Transit Railway and buses are the most popular ones. It can be said that the traffic system in Hong Kong has almost reached its upper limit that no more vehicles should be allowed on the road. Since public transportation can not be reduced, the only method to manage traffic congestion is to control the number of private cars.

To control the growth of private cars, the government has introduced a First Registration Tax (FRT) as early as 1974. The tax, charged when the vehicle is first registered in Hong Kong, has been increasing since then and is particularly for private cars. Following is the list of First Registration Tax in Hong Kong in 2011.[3]

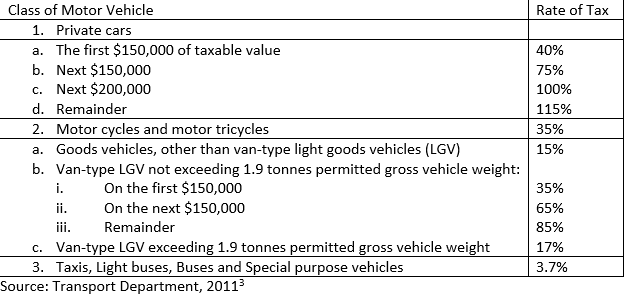
From the table, we can see that the taxes are mostly imposed on private cars and motor cycles, and the more expensive the cars, the higher the taxes. Some of the public transportation, such as taxis and buses, are also covered in the FRT system but their taxes are very low.

I can not find enough information about the distribution of tax revenue, but we can detect from the table above that most FRT is paid by rich people since only rich people will register expensive private cars. The tax for buses is extremely low, indicating that public transportation which is in service for most middle class and poor people, is almost tax free. In this taxing system, poor people are benefited while rich people are paying for most of the congestion cost.

Effectiveness

According to the research done by Mahmud Hassan TALUKDAR, the growth rate of private cars had experienced a rapid drop due to the imposition of FRT in 1974. The growth of registered private cars was 15.8%, 14%, 14% and 7.4% from 1970 to 1974 respectively. And the growth of private cars was -8.0%, -4.2% and 0.5% from 1974 to 1976 respectively. The fact shows a strong impact of the tax. However, it is unclear to what extent this policy has reduced the traffic congestion, because Hong Kong also implemented a 21-month congestion charging pilot from July 1983 to March 1985.[4] We could only assume from the growth rate of private vehicles that the number of cars on the road was effectively controlled, so the policy is considered effective.

2.  Tunnels Tolls

In addition to the FRT, Hong Kong government also implemented other policies to reduce the traffic congestion. For instance, tunnel tolls are charged in most road tunnels. Hong Kong consists of many islands, which are connected by more than 20 tunnels and bridges. The queues of traffic waiting for the over-capacity tunnel and bridges have blocked the adjacent traffic network and created a huge congestion problem.[5] The major tunnel tolls for major vehicles are summarized in the table below:

Vehicle type Cross Harbour Tunnel Eastern Harbour Crossing Western Harbour Crossing Tate’s Cairn Tunnel Tai Lam Tunnel Lantau Link #
Motor cycles $8 $13 $25+ $13 $20+ $20
Private cars $20 $25 $55+ $17 $36+ $30
Taxis $10 $25 $50+ $17 $36+ $30
Public light buses $10 $38 $65+ $23 $100+ $40
Private light busses $10 $38 $65+ $24 $100+ $40
Light goods vehicles $15 $38 $65+ $24 $38+ $40
Medium goods vehicles $20 $50 $90+ $28 $43+ $50
Heavy goods vehicles $30 $75 $120+ $28 $48+ $80
Single-decked buses $10 $50 $100+ $31 $115+ $40
Double-decked buses $15 $75 $140+ $34 $135+ $60
Each additional axle in excess of two $10 $25 $30+ $21 Free of charge+

Source: Transport Department[6]

We can see that the tunnel tolls have covered all vehicles that need to cross the tunnels, regardless of private or public. But if we look at a per capita level, we can find that the fees per capita for small vehicles are higher than those for large vehicles, which again shows a fair distribution effect that rich people need to pay more for the traffic congestion than the poor.

Effectiveness

The tunnel tolls was imposed since 1984. According to Mahmud Hassan TALUKDAR’s research, the tunnel tolls on the cross Harbor tunnel successfully reduced car and taxi goods traffic by about 15% and light goods vehicles traffic by about 13%. Overall, this policy is considered effective.

Conclusion and suggestion

Hong Kong is a crowed city with most of the roads are small two lanes roads, implying a continuous urgent in congestion management. After years of effort, traffic pricing policies in Hong Kong have achieved great success in private vehicle ownership control and congestion reduction. Successful policies include FRT, tunnel tolls and ERP. Other policies include fuel tax and parking control, which are controversial due to their effectiveness on congestion and side-effect, such as increasing illegal parking. To conclude, Hong Kong government should continue implementing FRT and tunnel tolls. Moreover, pursue more support for the implementation of ERP.


[1] http://countryeconomy.com/countries/compare/canada/hong-kong

[2] http://en.wikipedia.org/wiki/Transport_in_Hong_Kong

[3] TALUKDAR, Mahmud Hassan. “Transport Pricing Policy In Hong Kong.”Management Research and Practice 2 (2013): 30.

[4] Pike, Ed. “Congestion Charging: Challenges and Opportunities.” (2010).

[5] TALUKDAR, Mahmud Hassan. “Transport Pricing Policy In Hong Kong.”Management Research and Practice 2 (2013): 30.

[6]http://www.td.gov.hk/en/transport_in_hong_kong/tunnels_and_bridges/toll_rates_of_road_tunnels_and_lantau_link/index.html

Iceland Fishery


There are no other countries that are more dependent on fishery than Iceland. Due to its geographic superiority, lcelanders have been enjoying the ocean and living on fish for two hundred years. And thanks to its efficient fishery management system, Iceland is able to maintain an optimal fish stock as well as encourage the innovation in fishing technology. Interestingly, Iceland was not known for its prosperous fishery for centuries, rather, it was known by the world in 2008, when the global financial crisis gave the fishermen a critical strike and the country almost went bankrupt. It seems that it is time for Icelanders to invest in fish stock instead of money stock.

Introduction to Icelandic fishery

Iceland is the second largest island in Europe. Located beside the junction of East Greenland Current from the north and Irminger Current from the south, Iceland enjoys a flourishing fish stock in Icelandic water. Among its abundant and various ecosystem, there are about 25 species that have commercial importance and only a handful dominate the catches.[1] Main species include Cod, Haddock, Saithe, Redfish, Atlantic catfish and Greenland halibut, with cod products accounting for 35-40% of the total seafood export revenue.[2] During the catching seasons from January to October each year, total catches in Icelandic waters fluctuate between 1 and 2 million tonnes annually since late 1970s.[3] The export of fish products plays such an important role in Iceland economy that it makes up 41% of merchandise exports, 26% of total exports and 10.5% of GDP in 2011.[4]

Policy development

Iceland has a long history of fishery management starting from 1901 but it was not until 1976 that fishery policy really came onto the table. Fishery policy development can be divided into four major periods. First period is 1976-1983, when total allowable catch (TAC) was first introduced in 1976 because of the scientific concern of the spawning stock. A TAC of 230,000 MT was introduced and the fishing days were limited to 215 days per year. The second period is 1984, when a system of individual vessel quotas with some transfer rights were introduced, which covered Cod, Haddock, Saithe, Redfish, Greenland halibut, Plaice and ocean catfish. The third period is 1985-1990 when effort based option was introduced for those that preferred it. Yet, fishery management was not efficient in this period since there was friction between effort based fishing and quotas based fishing. Finally in 1990, the individual transferable quotas (ITQ) system was established for most of the commercial fisheries, which were all subject to vessel catch quotas instead of effort based fishing. The quotas, representing shares in TAC, are permanent, perfectly divisible and fairly freely transferable.[5]Iceland has experience of almost all the fishery policies, such as aggregate quotas, limits on catch effort and individual transferable quotas. After all the experiment, individual transferable quotas was proved to be the most efficient one. Since its establishment in 1990, there has been more control on the catches, which results in a sustainable development of the fishery.

Individual Transferable Quotas (ITQ)

The individual transferable quotas system is proved to be the most efficient system by the Icelanders. In the past 20 years, cod stocks were fluctuating around 200,000 tonnes, haddock and saithe stocks were fluctuating around 50,000 tonnes and demersal redfish stocks were around 50,000 tonnes.[6] There are some highlights of the Icelandic ITQ:[7]

  • The total allowable catch for each species is allocated by the Ministry of Fisheries and Agriculture each year.
  • The allocation of quota shares for each vessel is based on its share in the catch of each stock in the three years leading up to the establishment of individual vessel quotas for fishing from that stock. For the major groundfish stocks, this was the period 1981-1983.
  • A vessel can transfer some of its quota between fishing years but its quota is lost if it catches less than 50% of its total quota. And the net transfer of quota from any vessel must not exceed 50%.
  • In order to prevent consolidation of fishing rights by a few companies, each fishing company or a group of companies is not permitted to hold more than 12% of the value of the combined quota shares of the stocks.
  • A separate small boat quota system is available for boats less than 15 GT.

These five important elements of the ITQ system have insured the sustainability and efficiency of fishery. With total allowable catch for each species, fish stock can be managed and over-fishing can be prevented. With tradable quotas between vessels and between fishing years, efficiency is enhanced since quotas will be transferred to the most efficient vessels in the most affluent fishing year. With concentration control of the quotas, the rights of small fishermen are protected from big companies. Small individual fishermen are still encouraged to innovate in fishing method and technology, which diversify the fishery industry.

Enforcement mechanism

The Directorate of Fisheries is a government organization that is responsible to the issues of fishing permits, the allocation of catch quotas and the collection of all kinds of data on fishing. All the catch landed in Iceland must be weighed and reported in Iceland. If any excess catches is found, the vessel will be in risk of a revocation of fishing licenses and fines. Besides, buyers of the catch have to report value and amounts bought and the disposition of the catch, providing a double check of the catches. In spite of all the records, a team of inspectors would board fishing vessels to monitor catch composition and fishing equipment.[8] To conclude, there is a strong enforcement mechanism to support the implementation of ITQ.

Conclusion

As is mentioned before, the ITQ system has been proved to be the most efficient system in Iceland. Since there is a strict enforcement in support of its implementation, the discarding of fish is minimized. From the following table,[9] which shows the total allowance catch of some major commercial species in the past 10 years, we can tell that the fish stock is well managed and protected. Some stocks even increased in the past 10 years.

Hopefully, with reference to the experience of Iceland, BC can develop a better and more comprehensive fish policy in the near future.


References

Information centre of the Icelandic Ministry of Fisheries and Agriculture

http://www.fisheries.is/


[1] http://www.fisheries.is/ecosystem/

[2] http://www.fisheries.is/main-species/cod/catch-and-fishing-methods/

[3] http://www.fisheries.is/fisheries/total-catch/

[4] http://www.fisheries.is/economy/fisheries-impacts/

[5] http://www.fisheries.is/management/fisheries-management/system-developement/

[6] http://www.fisheries.is/management/total-allowable-catch/

[7] http://www.fisheries.is/management/fisheries-management/individual-transferable-quotas/

[8] http://www.fisheries.is/management/fisheries-management/enforcement/

[9] http://www.fisheries.is/management/total-allowable-catch/

Australia Carbon Policy

Australia Carbon Policy


Current carbon policy in Australia is a carbon pricing mechanism, which is also referred to as a carbon tax. However, since its implementation on 1 July 2012, there have been a lot of discussion and criticism about its effectiveness and distribution effects. As a result, the government recently has introduced some legislation trying to repeal the carbon tax and commence other carbon policies. Uncertainty about the repeal, as well as discussion and negotiation among different parties will remain until 1 July 2014, when the new financial year will come and the continuity of the carbon tax will be decided. Before the decision is made, let us discuss whether the carbon price is to blame.

Policy Origin and Goal

Carbon policy was firstly put on the political table by Howard Government in December 2006, when an emissions trading scheme was advised. Nevertheless, due to the change of government and leadership, the emissions trading scheme was never implemented. Research and negotiation about the detail of the carbon policy continued. It was not until the end of 2011 when the Clean Energy Act 2011 passed the Lower House in October and the Upper House in November that a carbon pricing policy finally came onto the stage. The carbon price was effective on 1 July 2012.

Carbon Pricing is the major part of a broad energy reform package called the Clean Energy Act 2011, which aims to increase energy efficiency and encourage investment in clean energy in order to meet Australia’s long-term target of reducing Australia’s net greenhouse gas emissions to 5% below 2000 levels by 2020 and 80% below 2000 by 2050.

How It Works

The carbon pricing policy requires corporations which emit over 25,000 tonnes of carbon dioxide equivalent greenhouse gases per year to report on greenhouse gas emissions and pay a price for every tonne of carbon pollution or equivalent greenhouse gases that they emit. The price of a permit for one tonne of carbon was fixed at $23 for the 2012-2013 financial year, and $24.15 for 2013-2014 financial year, with unlimited permits available from the government. From 2015 or 2016, it will transition to a flexible market price under a “cap and trade” scheme. Due to the characters of the industry, agriculture and transport sectors are exempted from the carbon pricing. 75% of each company’s annual obligation must be paid by 15 June each year and the remaining 25% by the following 1 February2. According to the 2012-2013 annual report, 100% of the 377 liable entities have reported their emissions and 99.74% of their liability was acquitted on time. The government has collected $3,630 million in carbon price revenue receipts with accrued revenue of $1,417 million due for collection in 2013-2014.

In order to reduce the burden on entities that face high carbon costs and are constrained in their capacity to pass through costs in global markets, the Jobs and Competitiveness Program, a part of the carbon pricing scheme, will issue free carbon units to eligible applicants. In 2012-2013 financial year, the government has issued around 89 million free carbon units to 123 applications who are in the most emissions-intensive industries in the economy that are highly exposed to international competition3.

The carbon pricing mechanism is actually a carbon tax on heavy emission companies in industries such as electricity generation, stationary energy, landfills, wastewater and industrial processes. Some highlights of the policy are:

  • Only cover big electricity generators and industrial processors
  • Fixed price
  • Unlimited permits
  • Free permits available

Compared to the cap-and-trade model, the tax model is an easier way for government to monitor and control the implementation and for clients to comply with their obligations. Besides, it will lead to a better result in the uncertainty condition where the abatement costs change. If abatement costs increase, the quantity of abatement will decrease; if abatement costs decrease, the quantity of abatement will increase. The flexibility of the abatement quantity allows companies to better adjust to the variation of the economy and minimize their loss. However, the carbon tax is also controversial due to its coverage and distributional differences.

Coverage and Cost-effectiveness

The carbon pricing mechanism is expected to cover a selection of large business and industrial facilities, which account for approximately 60% of Australia’s carbon emissions. In reality, the total number of carbon units lodged for 2012-2013 was 283 million, which means the carbon tax covers just over 50% of Australia’s 552 million units. Since the carbon tax was only implemented last year and many large businesses were receiving free permits, there is not enough evidence to show that the tax has an effect on greenhouse gas emissions. The emissions has decreased in the past five years while the economy also slowed down because of the financial crisis, so it is difficult to tell the effectiveness of the carbon tax. It is possible that the carbon tax has very little effect on the emission.

Distribution Effects

Since the carbon tax was introduced, wholesale electricity prices have increased significantly, which has increased the cost of households, small business and agriculture. This evidence shows that carbon tax has increased the cost of electricity generators who can transferred most of the cost to consumers. If there is not enough subsidy to the victims, the tax system will retard economy development and generate inequality. Some people argue that the agriculture sector is losing competitiveness because of the high electricity prices due to carbon tax. It seems that the carbon tax is affecting everyone except the polluters. There are a lot of redistribution problems in the carbon pricing mechanism.

Changes

To conclude, the carbon pricing scheme was well implemented but there is uncertainty about its effectiveness and revenue redistribution. Obviously, there is some problems in the policy design. Hopefully, the carbon tax will be repealed and a more comprehensive and efficient carbon policy will be introduced later this year.


References

  • Clean Energy Regulator Annual Report 2012-13, Australian Government Clean Energy Regulator
  • Clean Energy Act 2011, Office of Parliamentary Counsel, Canberra

My Story With Soybean

Last Friday, I made an awful decision which made me depressed for a whole week. The decision was SHORT MORE SOYBEAN, which cost me more than $10000 in a week and sent me to the bottom five of the trading game at the final round. Soybean really broke my heart. Suffering from anger and pain, I made another decision today: Kiss Soybean Goodbye!

My relationship with soybean was a long story. I shorted soybean from the first day of this trading game and since then he had never disappointed me. Unlike Corn and Wheat, which were always naughtily jumping up and down, and abandoned me during hard times, Soybean had always been so kind and loyal to me all the time. I shorted to open at the price of $13.19. From mid-September to last week, the price had kept dropping to $12.65 on Oct.15. So I decided that soybean could be the one to trust and the price would keep dropping forever. Thus, when the price of soybean was going up a bit last Friday, I shorted a huge amount of soybeans, hoping that he would bring me a fortune at the final round and we could have a happy ending.


Well, things never turn out the way you want and tragedy is always more impressive. Soybean future price jumped from $12.81 (when I shorted) to $13.09 within a week! Now it’s time to say goodbye and learn from the pain.

In the future market aspect, there are two reasons for the increasing price of soybean. Firstly, since the expired date of Soybean November contract is getting closer, speculators with a short position were currently covering soybean to offset, which pushed the price up. This can be proved by the volume data. In contrast to previous weeks, when volumes fluctuated a lot, the volume has become constantly larger since last week, around 120000. As more and more speculators covered to offset, future price will increase until the profit of offsetting equals zero.

The second reason is that spot price drives future price up. According to LOP, at the expired date, future price will equal cash price. But the basis (f-p) of soybeans has always been negative and the cash price is increasing recently, which together push the future price up. These two reasons combined have led to a dramatic jump of soybean price this week.

In the supply and demand aspect, recent news has a complicated impact on the future price: Demand boosted the market while supply descends the price. According to a USDA report early this week, the soybean export demand is increased compared to last year. During this active harvest and delivery season, foreign buyers, such as China and Russia, keep importing huge amount of soybeans since last week, which boost the spot market and pull up the future. On the supply side, dry weather ensures a good harvest weekend, which will lead to a rapid harvest progression and better- than-expected yields. As a result, the future price was first increased and then decreased.

Wow! I have been talking so much about soybean. It’s my hate and love. Burned my fortune in future market but produced my favorite soy sauce and tofu. What else can I say.

Trading game is coming to an end. The end of the game, the start of my real future!

Ciao!

October 25, 2013Permalink 1 Comment

C’est la vie

Since nobody will judge my blog this week, please allow me to take a break from the trading blog.

When I put the final exams on my schedule this week, I suddenly realize that it is already the end of October. How time fly! In less than two months, we will complete our first semester of the mfre program!

I have lived here for three months. Although I am always busy with so many assignments, projects and the coming exams, having no time to think about life, I do feel that life is so good here. And there are two things that keep surprising me since I came here. I just can’t help to think that mfre is such an amazing program and Vancouver is such an amazing city.

Besides all the interesting courses and friendly professors, I think the most amazing thing about mfre is gathering together all of us so that we could meet friends from different parts of the world and share our ideas and stories. Everyone is like a book. Every time I talk with you guys, I feel like reading novels. And every page is so surprising that I just can’t stop reading. I really appreciate mfre for bringing us so many lovely friends.

Another thing that amazes me is the beauty of Vancouver.

Summer is the season of splendid sunshine. The blue sea, the golden beach, the emerald leaves and everyone’s laughing white teeth, all glittering in the gorgeous sunshine.


Autumn is the season of dream. Trees and leaves became colorful overnight, like a magic show in The Imaginarium of Doctor Parnassus. Lonely yacht sitting peacefully in the quiet seashore, like the floating boat in the Life of Pi. Moist forest with suffusing fog, like the secret vampires’ home in Twilight. Everyday I feel like living in the movie scene.


Ok, I should stop dreaming and get back to work.

Good luck everyone with the midterms. Enjoy Life!

October 20, 2013Permalink 2 Comments

Stuck!

We are speculators, and speculators live on information and news.

Since there isn’t many news about the market this week, it seems we should take a week off and enjoy our mountains of assignments and midterms! And the coming Thanksgiving! 😀

Or, we could act like a cool forecaster, using technical tools to analyse the charts.


These two charts respectively show the prices of soybean in one year  and two years. They remind me of the trend forecasting models in 585. In spite of some fluctuation over months, the diagrams both show a downward trend of price. Although the price is unpredictable in short term, but I am pretty sure that the price will continue to go down in the rest of the year. And the price is quite volatile recently, there is still a chance to make a last bucket of money in the following two weeks.


The graphs of corn is more straightforward. There were some summits Jun, early Jul and late Aug. But after that, the price just keeps falling, like a snowball rolling down the mountain. And recently the price becomes flatter than before. Maybe it has come to the prairie and want to calm down a bit. Unlike Soybean, it is difficult to make lot of money in corn market in short period.

Anyway,my strategy is short for soybean and stay away from the corn. Back to my portfolio, I was stuck in a negative situation for four days. Fortunately, Friday brings me some luck so that I could happily enjoy the long weekend lol!


Have fun guys!

Bungee Jumping

I was Bungee Jumping in the future market this week. Monday, I was on the mountain top. Tuesday, I was suspended in the valley, waiting for the lifeguard. 🙁

I lost more than $10000 in one day because I made some silly mistakes on Monday. When waiting anxiously for the USDA grain stocks report, I mistakenly “stop buy” the corn instead of “stop sell”. When I suddenly realized the mistake in the afternoon, it was already too late! $0.1 dropped, and my $10000 gone with the wind.


Another thing that shocked me was the shut down of the US federal government. I didn’t know that a government could shut down in this way and the country could still keep running well. So what is the point of the existence of this government? Is it just a decoration?

Living under the control of the powerful government for twenty years, I regarded government as the pillar of a country. They are like the boss of a company and can manipulate everything and even everyone. Sounds pretty scary. We workers are so panic all the time but there is nothing we could do except working hard and avoiding mistakes. However, the government in the US is more like a manager, strong but not dominant. Citizens are the real boss. Government can quit its job while citizens can still live a peaceful life. What an amazing country.

What is more, it seems there is barely any impact of the government shut down on the agricultural commodities price. Despite the shut down of USDA and all the relevant webpages, prices of the three main commodities grew steadily in the following days of the big news, even more smooth than last week. I have two guesses about this situation. The first is that the agricultural commodities prices are quite independent of the government policies. The major factors that affect the prices are nature and market, such as weather, production, stock, supply and demand. The second is that most people are holding a “wait and see” attitude towards the shut down and are taking a break from the future trading, finally brings some peaceful atmosphere to the future market.

PS. There is shut down effect on livestock and dairy markets already. Maybe the effect on corn, soybean and wheat will come soon.

This is my portfolio of this week. Bleeding. T.T Hope to gain back next week!


Thanks!

October 4, 2013Permalink 1 Comment

Happy wheat

This is a busy week! Busy making money in the future game and catching the tail of the gorgeous summer! Well, it starts raining this morning, and I finally grab the chance to stay at home and take a break. And it’s blog time!

Here is my open position:


I started trading on Tuesday morning this week, when I suddenly found that the price of wheat is growing crazy, like climbing Grouse Mountain. I immediately bought in some wheat, hoping to get on this crazy roaring bus! And it turned out that I was pretty lucky. Here I am, smiling at the top of Grouse. 🙂

I didn’t change much about my portfolio of corn and soybean since these two guys were quite boring this week. Price of corn is fluctuating between 4.48 and 4.59, with no clue to predict which direction it is heading for. Price of soybean is even more stable, hovering around 13.17, losing its direction. Guess this is the human nature. When there is no information, people will just gamble on the commodity future, which leads to a zero-sum game of all.


Here are some important lessons I learned in this happy week:

  1. Get up early, watch the news and trade.
  2. Pay attention to the weather report around the world.
  3. Always set a limit or stop price instead of the market price.

It seems the price of agriculture commodities depends a lot on the weather, which has a strong impact on yield in this harvest season. If you get up early to check out the weather report and sign some contracts before anyone else does, then there will be a great chance to make some money in the rest of the day. This is the law of information spread, right?


PS:

We know that recent frosts in Argentina have caused a crazy increase in wheat price this week. But it is also reported that “Argentina expects a large crop of wheat next November despite recent frosts”. And the USDA will release Quarterly grain stocks figures on Monday. I am sure next week will be much more exciting!


Have a nice weekend!

Roller Coaster

The beauty of future is that it is unpredictable, which gives us a lot of surprising and depressing moments. Like sitting in a roller coaster, we never know what will happen in the next 0.1 second. Our future trading game is the same.

Instead of being a rational trader, concerning about every single movement of the market price and every update of the international news, I choose to be an emotional player, letting my feelings lead the way and enjoying the excitement of the game, rather than worrying when the next fall will come.

In this sense, I start my first venture, longing for corn and shorting for soybeans. I make this decision simply because I treat the graph as a roller coaster trip. When price is hitting the ground, it will bounce anyway. It seems the price of corn is almost at its lowest, so I bet it will go up in the coming week.

The graph for soybeans tells another story. It seems that the soybeans’ roller coaster has more fun. The price has gone through some peaks and troughs in the past few months, and it is now at an unstable and relatively high situation. So I bet it will go down and take a breath in the coming week.

Besides the excitement of going up and down, roller coaster can also bring us different views of the park. So I start to look around and see what happen in the corn and soybeans fields.

Firstly, the forecasts of the size of the 2013 corn and soybean crops come into my eyes. It is said that the average corn yield is 155.3 bushels per acre, larger than the August forecast. Another harvest report indicated that despite the late planting and recent drought weather, the corn in the southern area of the US is growing healthily, contributing to a four times larger yield than last year, which is even more than the forecast. However, good weather will not last for long. The coming fall freeze is predicted to threat the maturity of the remaining crop. It is reported that the corn crop will experience freeze-related yield loss in some parts of the Corn Belt. Given the harvested acreage and demand of corn unchanged, the price of corn will suffer some droughts recently, but still has a chance to surge in the coming autumn. Plus, the supply of corn in Argentina has dropped in this season, which gives me more motivation to hold the corn for long.

The situation of soybeans is quite opposite to the corn. The September forecasts reported a decrease in the average soybean yield, compared to the August one. While USDA said that the soybeans will yield slightly larger than last year. Anyway, rain has started to save the soybean fields recently, giving some hope to the soybeans yield. South America has also reported an increase in the record of soybean area. Wish it will make some contribution to the supply of the soybeans market.

After all these views, it seems that I should insist on my first choice. And I am going to find out the story of wheat next week.


This is my journey of the first week. Thank you for watching!