We have had some exciting advancements in our project. We have now received the full set of data from the Greater Vancouver Food Bank, outlining all the information on the best-before-dates of all the products that was received in February. Our policy suggestion can now be built on, as our group has derived an effective way to analyze this data. Although our project with the Greater Vancouver Food Bank is coming to an end, there is a lot of work set out for us within the next month. Given we are on the home stretch, we may potentially have a project scope change (University of British Columbia, 2018), in which we may deviate from our initial project proposal when taking into account our limitations, such as time or resources.
Weekly Objectives & Achievements
- Will analyze the best-before-date data and determine the amount of products that will be affected with associated policy changes
- Will create graphs to show how each food bank stream will be affected if the policy were to be shortened
- Will create our infographic that allows visual elements to represent the relevant information
- Will begin to think about how we can adequately relay our research to the audience that we may be presenting to
- Will start on writing the report and effective communication skills, focusing on coherence of our ideas and concepts
- Will keep in touch with Erin, Kevin, and the rest of the food bank to update them and ask any questions we may have concerning the data
Moment of Significant Change Workshop
During our tutorial, we had the chance to do a “Moments of Significant Change” workshop, in which we got together as a group and did some reflections on the knowledge, experience, and skills we have learned from this course and how do we feel about these changes. Every group member shared moments of significant change related to our Best-before date project in a short form. We chose 8 events that reflect the most significant changes. Individuals ranking were incorporated into the Figure 1.
The “What?”
After starting our project for about 2 months, being able to overcome some challenges as group, we mediated on the moment of significant change diagram. Figure 1 and Figure 2 below are the graphs we drew together in our tutorial.
The “So What?”
The dotted lines at the end of those two graphs stand for our future experience before the end of our project. Which will be a good note when we finalize our project and prepare for the final presentation. These activities allow us to evaluate our current project performance and think about points of improvements. It also gives us a chance to address unexpected issues.
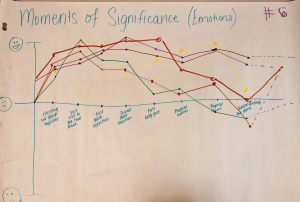
Figure 1. Moments of significance regarding emotion change.
This graph shows our fluctuating feeling of our six group members (each colour corresponds to a different group member) until Feb 27 of this project (events are in chronological order). The vertical axis indicates the levels of emotions, from feeling happy to sad. At the beginning of this project, most of us didn’t have any strong feelings about this project, however there was an overall increased rating after our first group meeting, which continued until our first visit to the Greater Vancouver Food Bank and first data collection. In the middle of February, the feelings of our group members began to diverge. This could be explained by our different schedules with classes, work and extracurricular activities. Midterms is an important factor for our decreased emotional levels during the time of our blog posts and proposal report. Understanding the data was the lowest point of our feeling, as we were overwhelmed by the data and confused about how we could use the data to get some useful conclusions.
Learning about how to interpret the data was a significant moment for many of us. As both Shulman (2005) and Harford (2016) emphasized, this uncertainty and “messiness” allowed us to exercise our creativity in order to determine how we will analyze the data. This creativity allowed us to come to a resolution by thinking differently, and adapting to one another’s thought process.
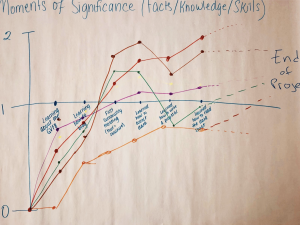
Figure 2. Moments of significance regarding knowledge levels.
This graph shows the moments of significance regarding the facts, knowledge and skills we have learned from this course. Each week brought different challenges. All of our group members were very much in agreement with our significant changes as indicated by the graph. All of us have felt increased significance from learning about the Greater Vancouver Food Bank to learning how to collect data because most of us never had the chance to get to know the details about the GVFB and blogging was new to all of us.
Now what?
However, our significance toward learning how to write a proposal started decreasing since this was not the first time for us to write a proposal, we have all written some proposals before taking this course. After that, our moments of significance started to rise when we were learning how to read the data sheet. Although all of our group members knew something about Excel, we have learned more about understanding the meanings behind those numbers.
Strategy for Project Completion (Graceful Dismount)
As the term drew to a close, we do not have much time to complete the project. By the act of reflection, we should not always be scrambling last minute to submit our assignments and do our work. Besides, our communication on social platform did not work very well. It will be really tough to work as a group if we lack communication and cannot ensure that everyone is on the same page.
In order to better complete the later work, we have come up with some strategies listed below:
- Find time outside of class to interpret the data we obtained in February using Excel, and sort out our problems
- May have our interpreted data checked by community partner, and draw conclusion for our project.
- Have good communication within the group. Check group chat regularly and response more timely.
- Set our own deadlines ahead of time, leaving more time for peer feedback and revise.
- Understand the requirements and tasks need to do for final report and presentation.
- Assign tasks to each group member more fairly, and help out each other.
- Consult with our community partner and TA for feedbacks and suggestion, if need be.
References
Harford, T. (2016). Ted Talk: How Frustration Can Make Us More Creative. Retrieved from https://www.ted.com/talks/tim_harford_how_messy_problems_can_inspire_creativity
Shulman, L. S. (2005). Pedagogies of uncertainty. Liberal Education, 91(2), 18–25. Retrieved from http://files.eric.ed.gov/fulltext/EJ697350.pdf
University of British Columbia. (2018). LFS 350: Session 8. Retrieved from http://lfs350.landfood.ubc.ca/session-notes/term-1-session-notes/session-8/