Welcome back to the blog!
To catch up on our previous weeks activities, check out posts 1 and 2!
It’s been a whirlwind last few weeks for all of us, getting over the midterm hump and pushing the research project forward. There has been some ups and downs. But we have learned a lot in the last couple weeks, especially with regards to the logistics of consent forms, approval processes, and patience waiting for our survey responses to trickle in. And we have made some significant advances with the project to date.
Week 7 (Oct. 16-22)
Objectives:
• Create an email survey to be distributed to select past and present Burnaby Artisan Farmers’ Market farm-specific vendors
• Draw up an appropriate consent form to be approved by UBC LFS 350 TA
• Determine the vendors to include in the email survey
• Distribute the email survey on Oct. 21
Achievements:
• The email survey was completed using Google Forms
• A consent form was developed using UBC guidelines that was approved by our LFS 350 TA following several back-and-forth email interactions to get it just right
• A list of past vendors going back to 2014, as well as present vendors was inputted into an Excel document
• The survey was not distributed as planned. It was finalized and sent to the project partner on Oct. 23, and was waiting approval from the Artisan Farmers’ Market Society board.
Week 8 (Oct. 23-29)
Objectives:
• Finalize the mail out list for past and present farm vendors
• Distribute the email surveys
• Transcribe in-person market interviews to electronic database
Achievements:
• We finalized the mail out list for vendors, opting to include all past and present farm vendors from 2014 to 2017. Our sample size is relatively small (16 present, 13 past) and our expectation is that not all will respond. By sending the email to all, we are hoping to have a large enough sample size to adequately analyze.
• We received approval of our email survey on Oct. 25 and distributed the surveys via email on Oct. 26. We included a response deadline for Nov. 2. We felt a week was a good amount of time to think about the survey and respond without forgetting about it.
• Six in-person market interviews were transcribed into electronic format on Oct. 28.
Week 9 (Oct. 30-Nov. 5)
Objectives:
• Follow up with past farm vendors who completed the survey via email
• Analyze data and start working on tables and graphs
• Start drafting the final report and infographic
Achievements:
• By Nov. 2, we received 1 survey response. We sent a reminder email with the survey on Nov. 2. We called the vendors on our list from Nov. 2 to Nov. 5 reminding them of our request. We now have 5 responses. We may have to rethink our population size
• Without responses, we were not yet able to get started on the data
*********
Moment of Significant Change Workshop:
During the Week 9 tutorial, we used the Moment of Significant Change (MSC) technique to graph the changes in our emotions, skills, and knowledge that has occurred throughout the progress of our project so far.
First, we individually graphed the significant moments reflecting on experiences from the course and our personal lives. In comparing our graphs, we shared stories about the reasons we felt the way we did and how our skills and knowledge increased as we worked through our individual periods of uncertainty. Our reasons for emotional changes varied from project progress, receiving feedback on assignments, to struggling with early mornings, as well as struggling with the balance of school and life. This activity brought us closer as a team as we were able to share our emotions and personal experiences on the initial goals and expectations of the project’s activities. With this strengthened foundation, as a team, we are now better able to identify areas of which we can better support each other and areas we can build upon.
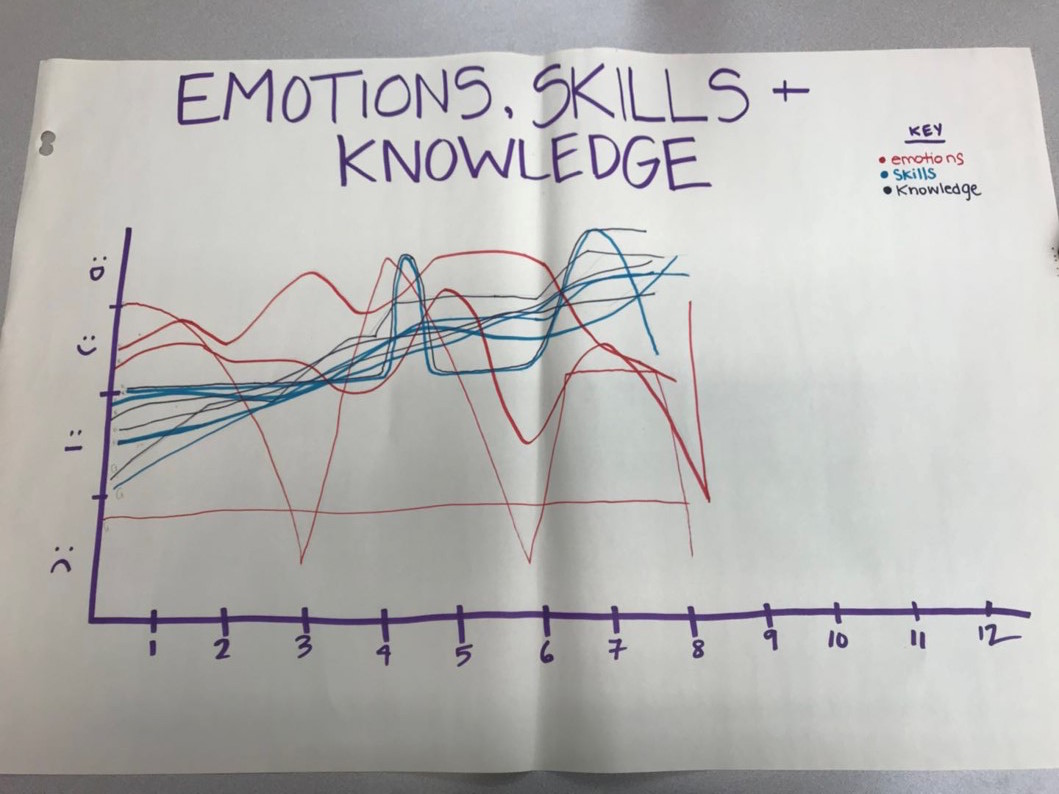
At first glance, our graph looks like a bunch of jumbled lines, upon closer inspection, there are weeks where our lines take on similar shapes.
Reflecting on our graph, it is clear that as a team, our emotions were all over the place. Most of us started off the course (weeks 1 and 2) with positivity and excitement for the project and the experience of tackling a real life, complex issue. In these weeks, there is a noticeable upward trend in both our skills and knowledge as we began to dive into the course and learn about food justice and asset-based community development. By the time week 3 came around, we experienced an emotional dip as we met with our community partner and became slightly overwhelmed and uncertain with the amount of data input and analysis required. As we listened to Tara and went on the farmers’ market visits (weeks 4 and 5), we began to get a fuller picture and increase our knowledge of farmers’ markets and the importance of this undertaking. Within those weeks, we also began developing our data input, interview, and our proposal writing skills, which also added to the upward trajectory of our graphs. With the approach of weeks 6-9, our emotions seem to have some ups and downs as midterm season comes and goes, as we develop our surveys, send them out, and finally as we hit a point of uncertainty in the progress of our project with the underwhelming response to our surveys. Although our emotions have waned these last few weeks, our changes in skills and knowledge haven’t, we continue on the upward trend; developing confidentiality form writing, survey development, and learning to adjust to unexpected changes.
Moving forward with our project, we know that there will be more ups and downs along the way as we revise our plans, but we hope to be on the upward trend to achieving our objectives.
*********
A Graceful Dismount:
As we near the end of term and our final presentation, we realize that we may need to revise our approach set out in the proposal to achieve our objectives. We recognize that projects don’t always manifest in ways we set out, but being able to cope with these unexpected events and discuss them as a team creates learning. As Schulman stated, “Without a certain amount of anxiety and risk, there’s a limit to how much learning occurs” (Shulman, 2005, p. 18).
Based on the amount of responses we get after reminding vendors of our survey, we will discuss changes we may need to make moving forward. Strategies for developing our report and infographic are to continue encouraging each other, reminding each other of important dates, expectations, and sharing tasks. We will also be looking to analyze the data we do have, without making assumptions too quickly on what the data may show. Tara, has been great in supporting us through regular communication, therefore, we again stress the importance of communication and respect with each other and our community partner to a graceful dismount.
********
Coming soon: our final update!
References:
Shulman, L. S. (2005). Pedagogies of uncertainty. Liberal Education, 91(2), 18–25. Retrieved from http://files.eric.ed.gov/fulltext/EJ697350.pdf