Well, time has certainly flown us by, as we are embarking on our final weeks working as a collective.
To catch up on our experiences & accomplishments to this point, check out blogs 1, 2, 3!
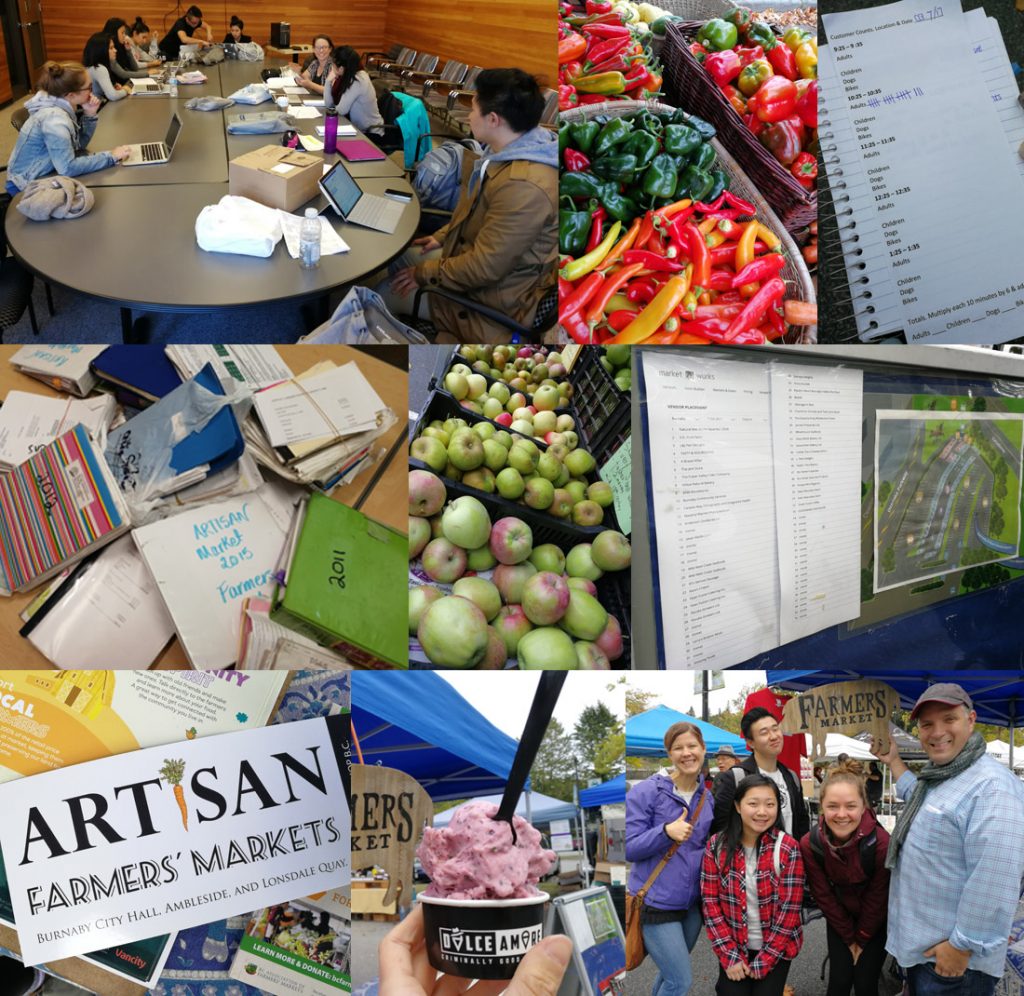
It seems not long ago that we were four strangers receiving our community project, beginning to get to know one another, and preparing to dive into this real-life, complex issue. We feel that our team has worked extremely well with each other; supporting each other in our weaknesses and building each other up in our strengths. We have gotten to know each other considerably well in the past 12 weeks, being able to help each other out when our emotions or school work causes us to falter.
While we can’t believe that this is the end for us in this project, we are excited to see this project continue. There is definitely more to come from both future LFS 350 students, and us as professionals out in the world. Armed with this experience, who knows what will be explored next!
Before we say farewell, we have one last story from our journey to share…
*********
A Moment of Significance:
What:
Last post, we touched on the uncertainty we felt with the underwhelming response to our nominal-style surveys sent out to farm vendors.
While we were developing our surveys and preparing to send them out, we were content with the progress of our project and excited for the amount of data that would eventually trickle in. We were anxious to discover which aspects of the Burnaby Market are most important to vendors when deciding where to sell, as well as what conclusions and recommendations could be made to present to the Artisan Farmers’ Market Society.
As you can imagine, we were pretty surprised by the small amount of responses we received, especially following our market visit where the vendors showed interest in our research. At this point, we weren’t too sure what our next step would be, as we were running out of time before we had to present our findings and produce a report for the Society.
We spoke with our professor Will Valley about our concerns regarding the limitation of our pool of data. He suggested that we do some cold calls of vendors, and told us that we had enough of a population size to work with as long as we mentioned it as a limitation. He also told us not to underestimate the qualitative data that we had obtained in our market visits. Although small, it’s still considerable, he told us. Analyzinig our qualitative data, we recognized that the vendors we spoke with wanted to be there, rather than the other, considerably larger markets in the Lower Mainland. This was significant. In our first meeting, our project partner told us vendors chose Burnaby when they couldn’t get into the Vancouver Markets; our data showed otherwise.
We opted to call during the week, hoping vendors would be less busy and more willing to complete the survey. We cold-called approximately 15 vendors (our pool of farm-specific vendors was small to begin with) encouraging them to respond to our survey and call for further information if needed so that we could have a better representation of their perspective in order for the market to better support them. We decided that if we didn’t get the amount of data we had hoped for by the following week, we would use the flexible learning time to get together and figure out our next step.
*********
So What:
While the cold calling did increase the amount of responses we got to our surveys, we still had about half the number of responses we were hoping for.
Our team met up to discuss and analyze the data we had. As we were discussing we realized that though our population size was small, and of course we wouldn’t be so bold as to say our findings could be applied to all vendors, we found that we did have something significant. We discussed the responses to the survey and how eye opening it was that many of the responses were positive. We were also surprised by the notice and concern, by vendors in the survey responses, of reselling in farmers’ markets as a whole. Interestingly, this was something we had witnessed at one of our market visits, when a vendor was asked to remove some of their product because it was discovered that it was imported. We set out to categorize the assets and limitations that the vendors most often spoke about and developed charts and graphs to better present our findings.
Finally, we were finding direction yet again.
We try to remind ourselves that projects don’t always work out the way we plan and that the way we react can help us become more creative (Harford, 2015). Thinking back, taking what Tim Harford (2015) said in his TedTalk, we needed to “gain a bit more appreciation for the unexpected advantages of having to cope with a little mess”.
Splitting up the remaining tasks and discussing the information to showcase in our infographic, we were well on our way to completing our objectives.
*********
Now What:
Ultimately, we are content with how our project has turned out. Yet, we realize that we would have benefited from notifying vendors during our market visits to look out for the upcoming survey, or distribute paper versions of the survey in order to have had more data to work with. With more data, we would have been able to bring more clarity and certainty to the assets and limitations of Burnaby Artisan Farmers’ Market, as well as what aspects of a market are most important when vendors are deciding where to sell.
We are now in the homestretch of our project: we’re finalizing our research report. We have submitted a draft of our infographic and are preparing for our presentation in the Nest, on November 29 from 2 – 3:30 pm in front of Blue Chip. Our group, along with our classmates, will be engaging in interactive conversations with our peers, TA’s, faculty, and the general public, to showcase our projects and address food justice issues in our community and province.
As the project draws to a close, we’d like to thank Tara and the Artisan Farmers’ Market Society for the support, invaluable experience, and opportunity to collaborate in engaging with complex issues in our community.
It’s been an incredible journey!
References:
Harford, T. (September 2015). How messy problems can inspire creativity. TED, Tim Harford, London, 2015. [Video File]. Retrieved from https://www.youtube.com/watch?v=Jd_j_kw_jZQ