Background
The methodology for this analysis was inspired in part by Garcia-Palomares et al.’s (2012) study on utilizing location-allocation as a tool to determine potential locations for bike-share. Location-allocation is a common tool to determine the best location for a store or a fire hall (for instance) out of several candidate locations based on demand. The entire process from inputting data to generating the result can be summed up in 4 (generalized) steps:
- Find facilities: this means to locate potential sites for bike-share stations.
- Determine demand: locate demand for the service.
- Define barriers: define any point/line/polygon barriers.
- Calculate result: finds the best locations.
There are a host of other settings that can be defined in ArcGIS and the process can be quite complex; however, the main steps outlined above are used to determine the locations of facilities which are able to supply the demand most efficiently.
Before any of this occurs, the preliminary step required by ArcGIS is to create a network dataset to model the transportation network within the study area. This was simply created from the public streets layer provided by the City of Vancouver. Other streets (private, alleyways) were excluded from this study.
Garcia-Palomares et al.’s (2012) study on Madrid harnessed data on trips within the the city as well as detailed information on the number of jobs at the building level to locate the demand (p.239). Unfortunately, due to the limited amount of data found for Vancouver, I was unable to follow their specific methodology step-for-step.
Location-Allocation Analysis for Vancouver
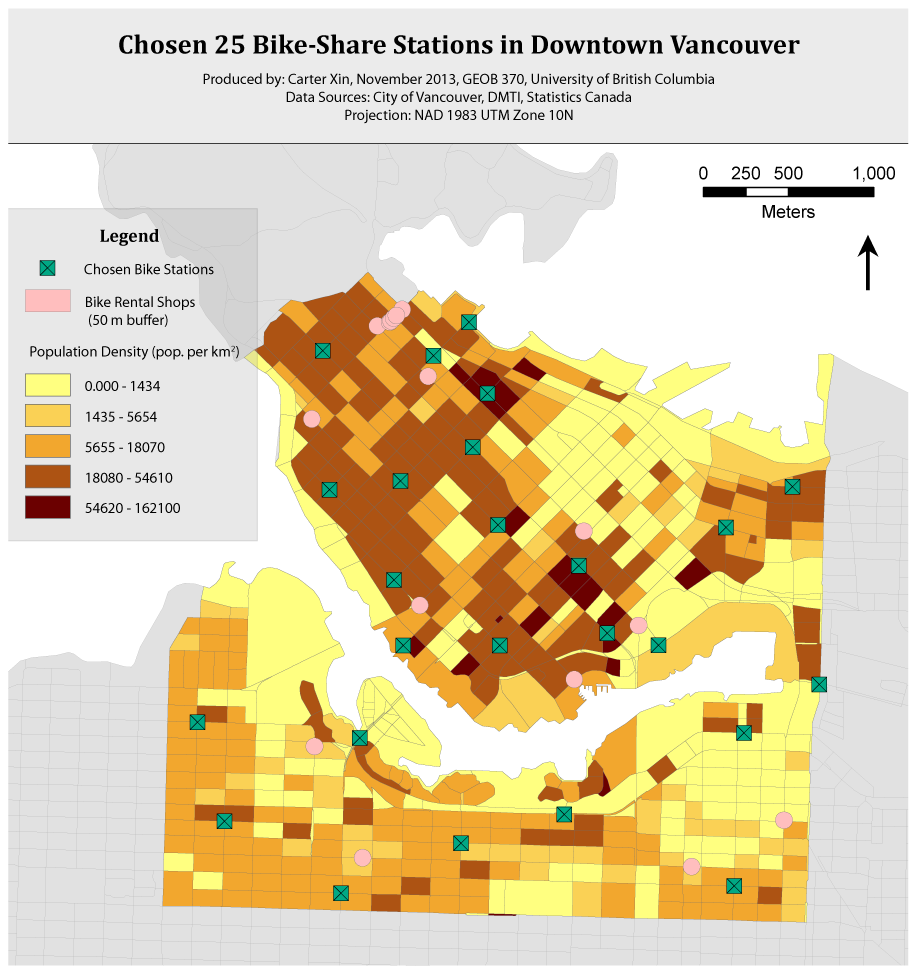
For Vancouver, I wanted to look first at locating 25 stations in the study area (within the boundaries of 12th Avenue, Arbutus, and Main, excluding Stanley Park) followed by 125 stations.
Street intersections provided the candidate facilities. Within the study area, 1489 street intersections were enumerated. To clarify, bike stations are not limited to just street intersections; they may be located anywhere on the street or sidewalk, or in plazas, parks, and private land (CoV, 2013, p. 27). Nevertheless, due to data limitations and simplicity’s sake, street intersections served as a substitute.
Demand was calculated using dissemination block (along with the population attribute) which were converted to points by determining their centroids. Each point was weighted for demand based on population. 615 demand points were identified in the study area. There are limitations to just using the population measure provided by StatsCan, see Limitations for an explanation.
Finally, existing bike-rental businesses were digitized and buffered 50 metres to create polygonal barriers. No stations can be located here as the City does not wish to compete with local business (CoV, 2013, p. 32).
These other settings were used: minimize impedence, from demand to facility option.
Solving the location-allocation problem returned this result for 25 stations:

And for 125 stations:


It is clear that the stations were located in areas of high population density. Accordingly, few stations were located in areas of low population density.
Bikeability Surface for Vancouver
The results of these chosen locations give no weight to bike infrastructure or topography. To address this concern, I proceeded to examine the bikeability of the study area.
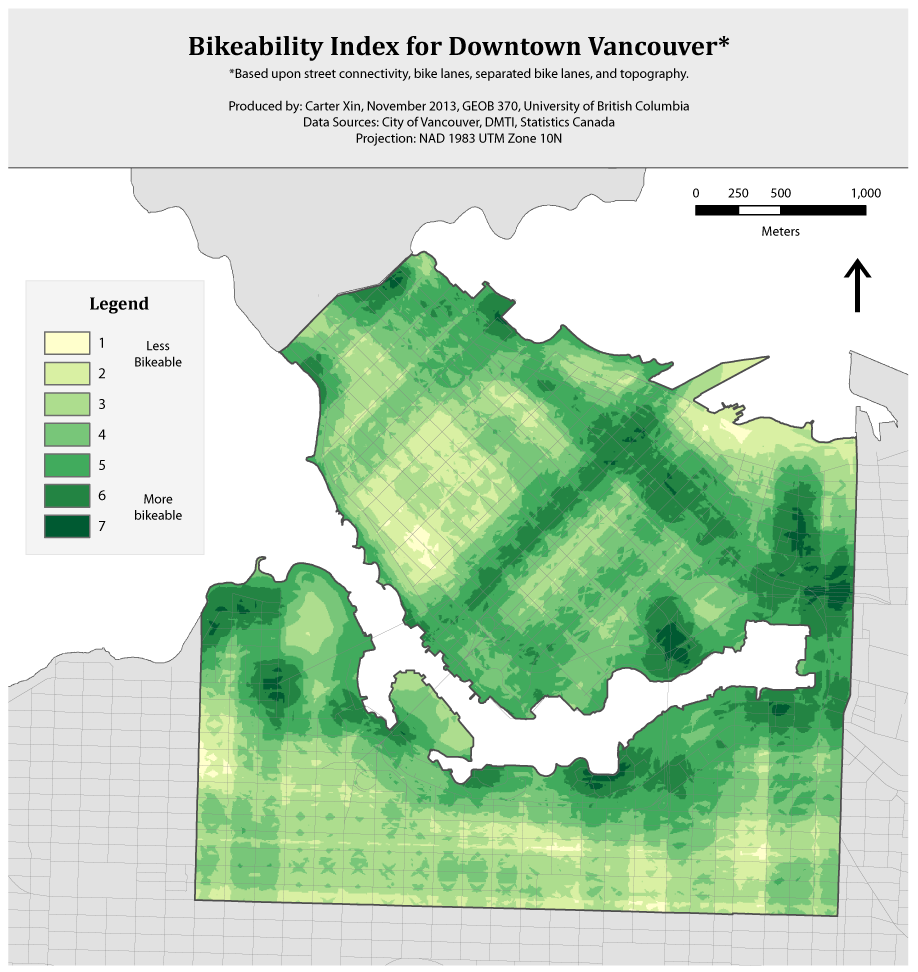
I created a bikeability surface loosely following Winter et al.’s (2013) index for bikeability, produced for the Lower Mainland. This considered 5 factors: connectivity of bike lanes, bike lane density, separated bike lanes, topography, and biking destination density.
Their study examined bikeability across the entire Lower Mainland, which produced high bikeable ratios for many parts of Vancouver, especially downtown. In this study, I wanted to enlarge the scale to study the nuances in bikeability within the bounded study area around downtown. Unfortunately, a lack of specific data on land use led me to omit the last factor of destination density.
My bikeability index accounted for these measures which were used to produce 4 raster output maps:
| Measure | Data and Source | Manipulation | Output |
| Street connectivity | Street intersections (CoV) | None | Intersection point density map (street connectivity) |
| Bike lanes | Bikeways (CoV) | None | Bike lane density map |
| Separated bike lanes | Bikeways (CoV) | Manually selected separated bike lanes, Calculated Euclidean distance | Distance from separated bike lanes map |
| Topography | DEM (DMTI) | Resampled to 5m | Slope map |
I then normalized all the raster maps to a common scale of 1-10, 1 being least bikeable and 10 being most bikeable. Finally, each raster map was equally weighted using Weighted Overlay (25% weight for each measure) to create a final bikeability index from 1-7 for the downtown area. The result:

With this accomplished, I wanted to compare and contrast the bikeability of the downtown area with the results of the 125 bike-stations. By combining the two cartographic renderings in my final analysis, I was able to see if stations were located in highly bikeable areas (or not). The final, combined map with a discussion on my findings is located in the Results & Discussion.