GEOB270-Lab2

  • Review your answers to question 2 and 5 to answer the following: for general audience, describe how to fix misaligned and improperly referenced spatial data, including taking into consideration project properties.
  • Review your answer to question 11 and discuss the advantages to using remotely sensed Landsat data for geographic analysis.


Accomplishment Statement:

(1)The Misalignment and/or improperly referenced data are commonly occurring when analyzing the geospatial data. However, the most common projection is often best matches with specific area because of the geography of the local context. Also, during the map-making process; we have to make sure the data we are using is compatible, which refer to all the units should be the same and your coordinate and projection systems should be the same across all files as well.

 (2) Remotely sensed landsat data is widely used by geographic analysis. It contains various data layers that can be adjusted to highlight different changes in the landscape. And it’s also free for public to access it. By doing so, lots of geographers and environmentalists can enhanced their  academic research towards many disciplines related to the environment (climate change, agriculture, forestry, water, land-use and land cover change, natural disaster management, and wildfires) which would have improved government policies and decision-making (USGS, 2012).

GEOB270-Lab3

mylab3map


QUESTION 5 (1)What percentage of the City of Vancouver’s total area is in danger? Explain what method you used.

The total area in danger: 1587.653272 Ha

The total area of Vancouver: 13102.060002 Ha

1587.653272/13102.060002=12.1%


QUESTION 6(2)By using the appropriate selection method, create a layer containing the health care and educational facilities within the City of Vancouver danger zone. List the resulting facilities, if any. Check your results visibly. Explain how you came up with your answer

Health care facilities in danger:  FALSE CREEK RESIDENCE,VILLA CATHAY CARE HOME,YALETOWN HOUSE SOCIETY,BOARDWAY PENTECOSTALLODGE

Educational facilities in danger:  HENRY HUDSON ELEMENTARY, ST ANTHONY OF PADUA, ECOLE ROSE DES VENTS,EMILY CARR INSTITUTE OF ARE & DESIGN,

First, using select by location, we’ll select form “Vancouver_education” and “Vancouver_health”,  overlying with  “Vancouver_danger” in the source layer. Then,  “danger_health” and “danger_education” will be exported  as the selected data. Finally, double check the attribute table of the exported layers.


Accomplishment Statement

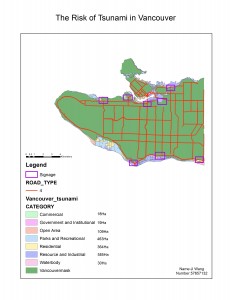
By using the tabular Vancouver City data, and analyzing by  ArcGIS software, I am demonstrate a map indicate the risk of tsunami in City of Vancouver. We can see from this map  the high-risk areas if a tsunami impacts Vancouver.


Spam prevention powered by Akismet