> AirQualityIndex <- read.csv(“h:\\AirQualityIndex.txt”, header=TRUE, stringsAsFactors=FALSE)
Read in data into table AirQualityIndex
> AQI=AirQualityIndex$AQI.O3
Set AQI array to data in column AQI.03
> range(AQI)
[1] 8 49
Range of values for AQI
> breaks=seq(8,50,by=6)
Create an array of values broken into intervals of 6 beginning at 8, then 14,…
> AQI.cut=cut(AQI,breaks,right=F)
Data is classified into intervals
> AQI.freq=table(AQI.cut)
Summarizes data, counting the frequency of data per interval
> AQI.freq
AQI.cut
[8,14) [14,20) [20,26) [26,32) [32,38) [38,44) [44,50)
5 12 10 4 3 1 1
Outputs the the freqency of values per interval
> nrow(AirQualityIndex)
[1] 36
Row count of values.
> AQI.relfreq=AQI.freq/(nrow(AirQualityIndex))
Calculate the percentage of values per interval divide the interval count by the total number of rows
> AQI.relfreq
AQI.cut
[8,14) [14,20) [20,26) [26,32) [32,38) [38,44) [44,50)
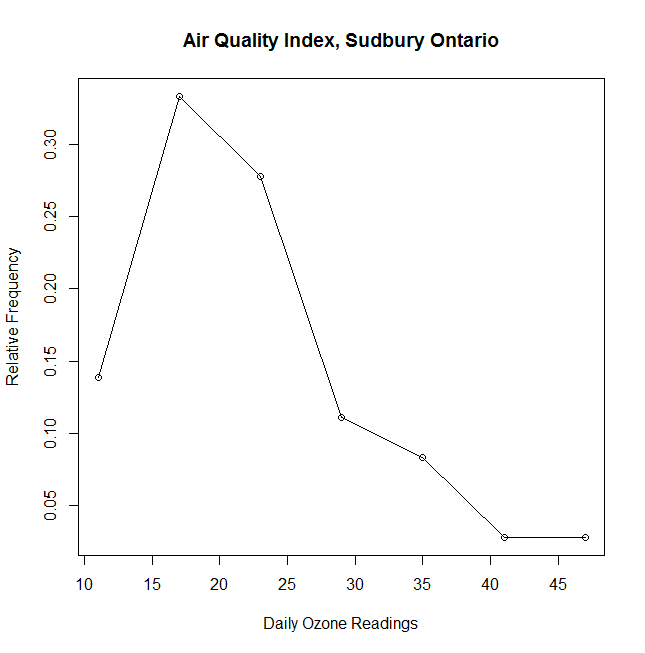
0.13888889 0.33333333 0.27777778 0.11111111 0.08333333 0.02777778 0.02777778
> nrow(AirQualityIndex)
[1] 36
> midpoints.breaks=seq(11,47,by=6)
> midpoints.breaks
[1] 11 17 23 29 35 41 47
> plot(midpoints.breaks,AQI.relfreq, #plot the data x is midpoints.breaks, y is AQI.relfreq
+ main=”Air Quality Index, Sudbury Ontario”, #+ main title
+ xlab=”Daily Ozone Readings”, #+ label – horizontal axis
+ ylab=”Relative Frequency”)
> lines(midpoints.breaks,AQI.relfreq) # connects the dots with lines
> axis(side=2) # display y-axis values