Memo: Environmental Assessment of Garibaldi at Squamish Project
The Garilbaldi year-round mountain resort is set to be constructed in Garibaldi at Squamish. As a resource planner, I have created an environmental impact assessment to provide information on potential effects on vegetation and fish and wildlife habitat, and provide a series of recommendations to prevent or reduce any significant environmental, social, economic, heritage and health effects in proposed project area.
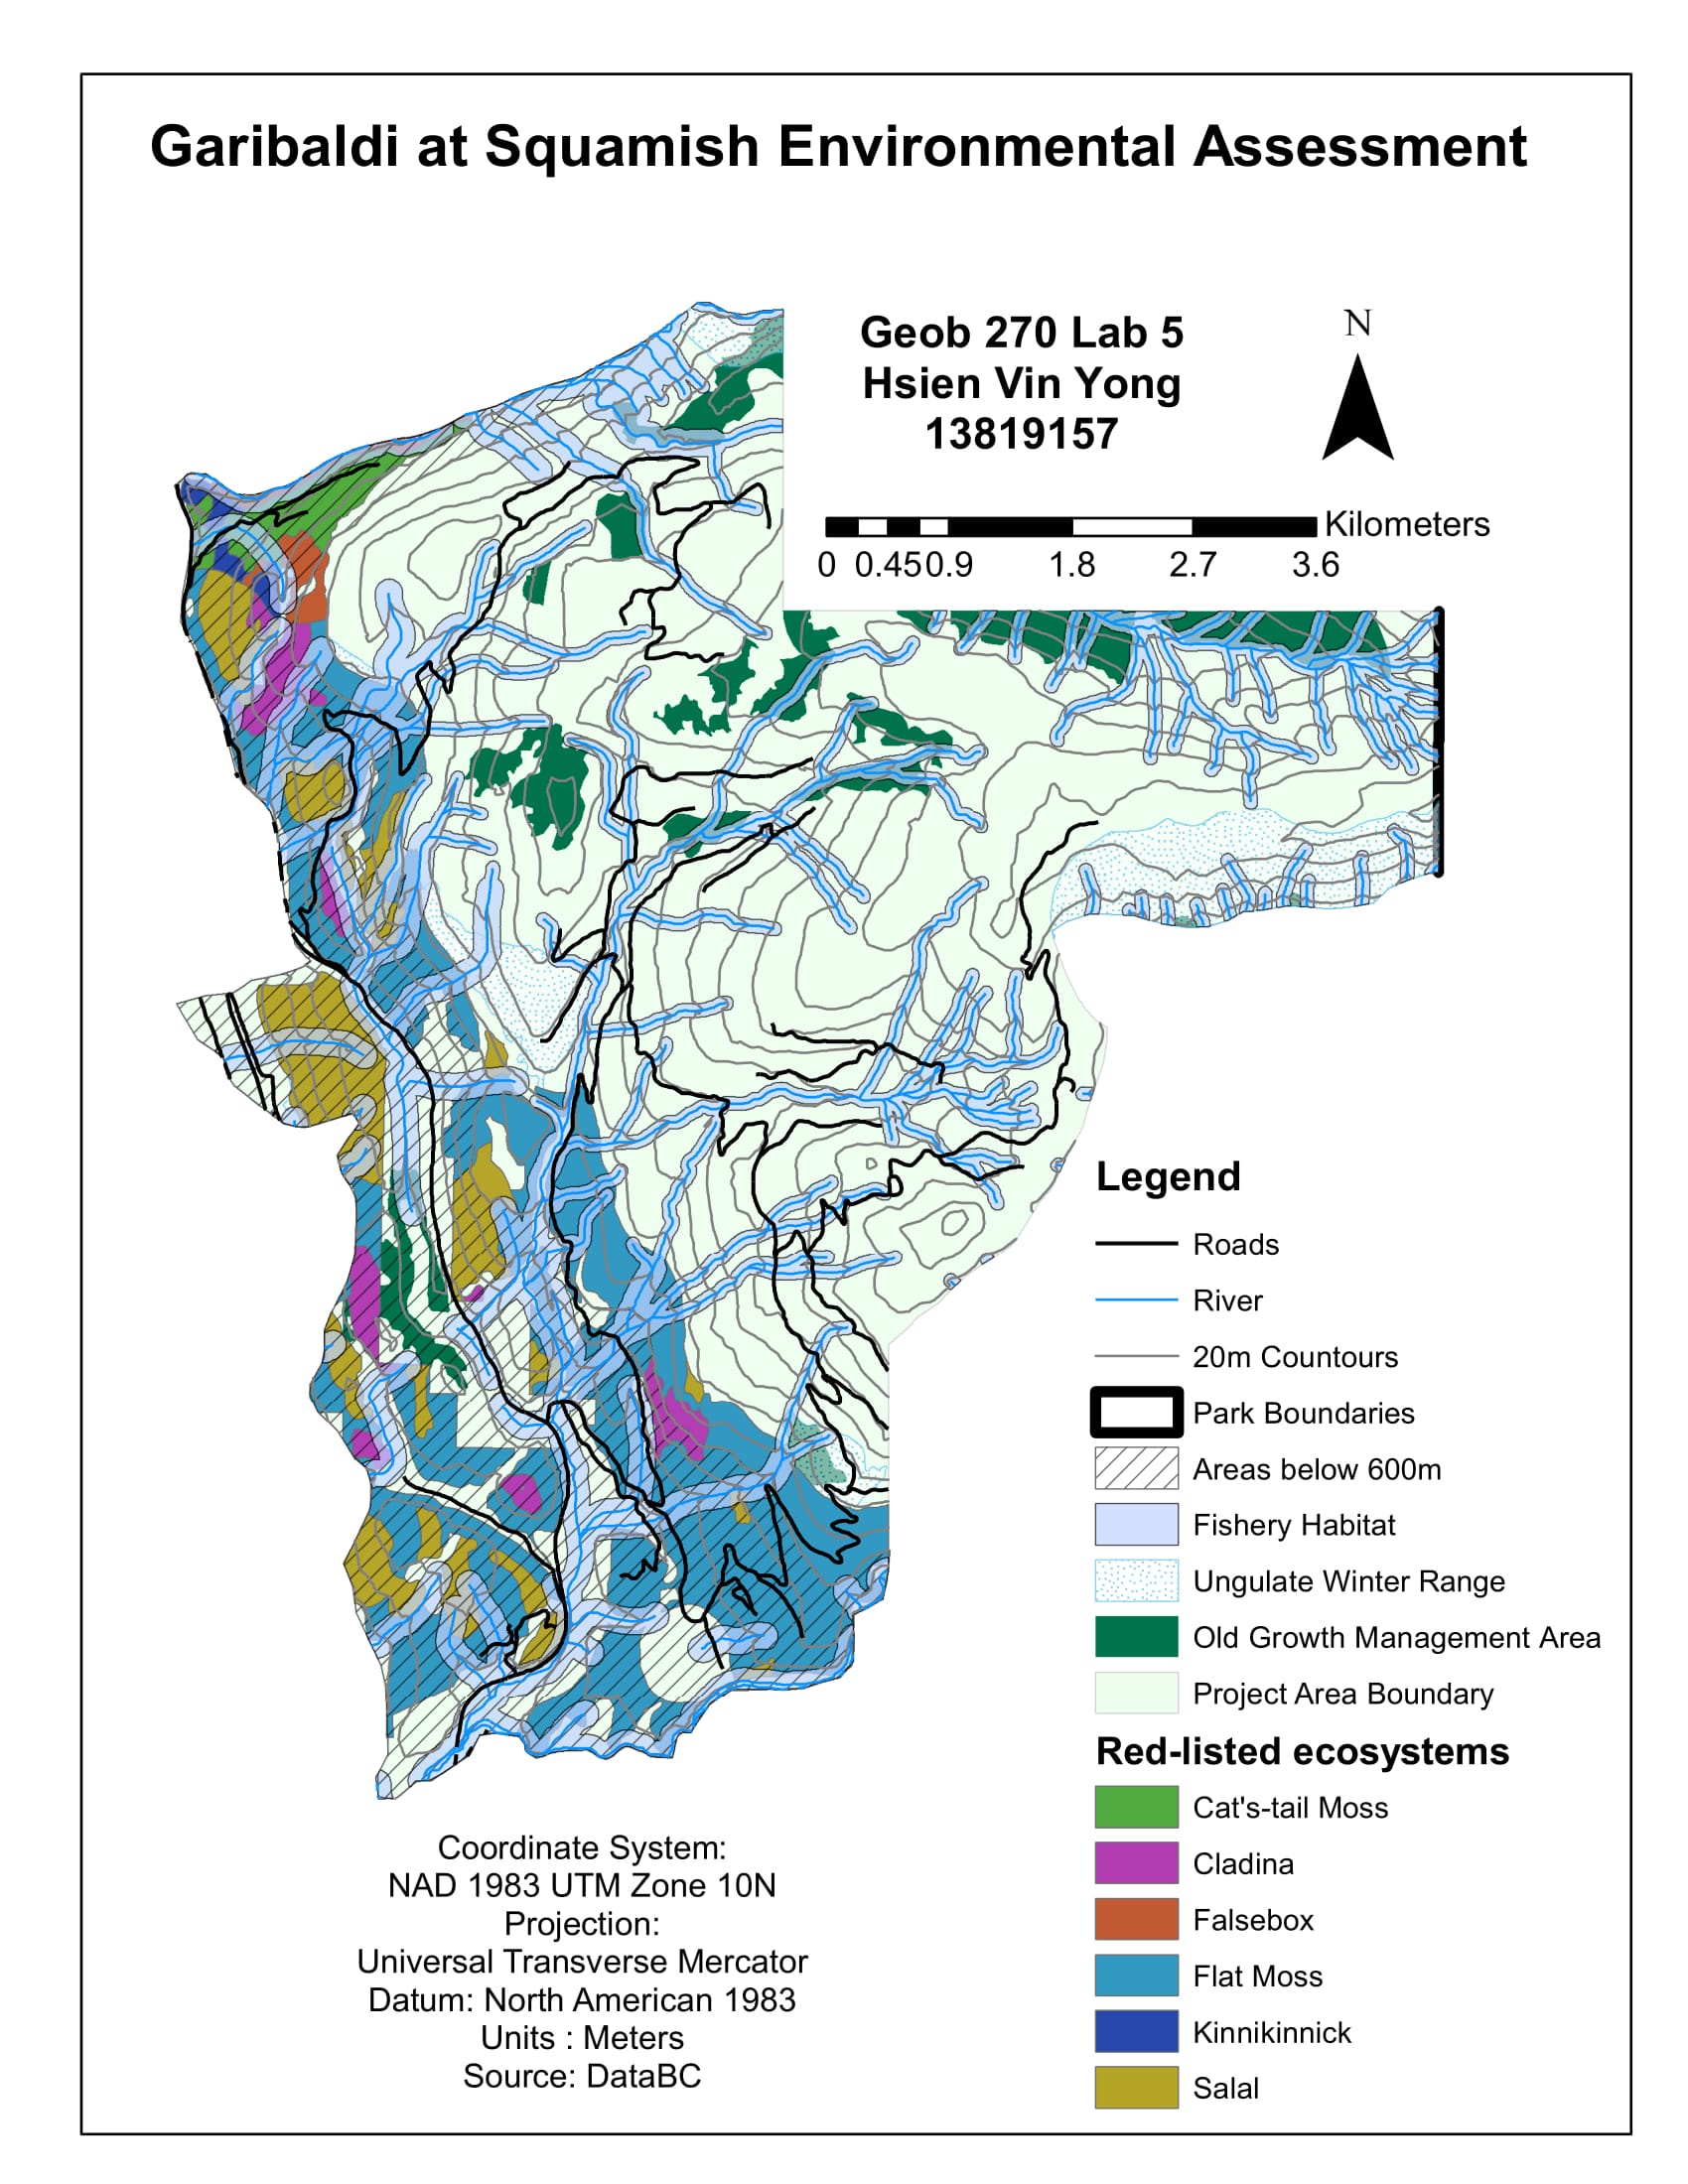
Firstly, I assessed the elevation in which the actual snow cover would be available to the ski resort, where areas below 600m would not potentially have enough snow to support the Ski Resort. In my results, 32% of the land were under 600m in elevation which meant that 68% of the project area elevation were above 600m. Therefore, it was economically viable for the proposed Garibaldi Ski Resort to be constructed and operated.
Next, I accessed the sustainability and the environmental risk of the Garibaldi Ski Resort. I had to examine the data where all the ecosystem species that existed in the project boundary area, the TEM (terrestrial ecosystem mapping), Old growth forest, ungulate habitats, red-listed species and fish bearing streams; which I created a map that would identify and locate the protected areas and at risk of the Ski Resort. These were the resulting area percentages of total project area that would be impacted by the construction of the Ski Resort:
- 8% of old growth forest
- 9% of ungulate habitats
- 8% of red-listed species
- 4% of fish bearing/ riparian areas around streams
Adding up together, these percentages sum up a total wildlife area of 67.9%. However, the total project protected area is 53.7% which is smaller than the total wildlife area of 67.9%. Hence, this meant that the protected area are not large enough to ensure the safety of all the ecosystem in the proposed project total area. This shows an environmental risk in which the surrounding ecosystem that are not part of the proposed project area might be negatively affected and potential environmental damage.
The two greatest environmental concerns are: 1) the unpredictable impacts that the project could potentially damage the environment, as the total wildlife area is more than half of the project area hence causing more harm to that area then benefits. 2) The loss of old growth forest will drive some species to extinction as some species may only thrive in old growth forest conditions, and removal of tree/vegetation support may increase the risk of landslides hence more cost would need to be allocated to landslide mitigation measures. The best way to mitigate all environmental impacts which is to not construct the resort in the project area and to just leave current environment as it is, that way, there will be no damage to endangered species, fish bearing areas, ungulate habitats and old growth forests.
Personal Take on the Garibaldi at Squamish Project proposal
When working on environmental projects, sometimes an individual has to become involved in proposals that they do not ethically believe in. I think the project should not be allowed to continue because of the evident data showing that the ecosystems are potentially at risk to environmental due to impacts that the project may caused. I have voiced these concerns in my memo as well.

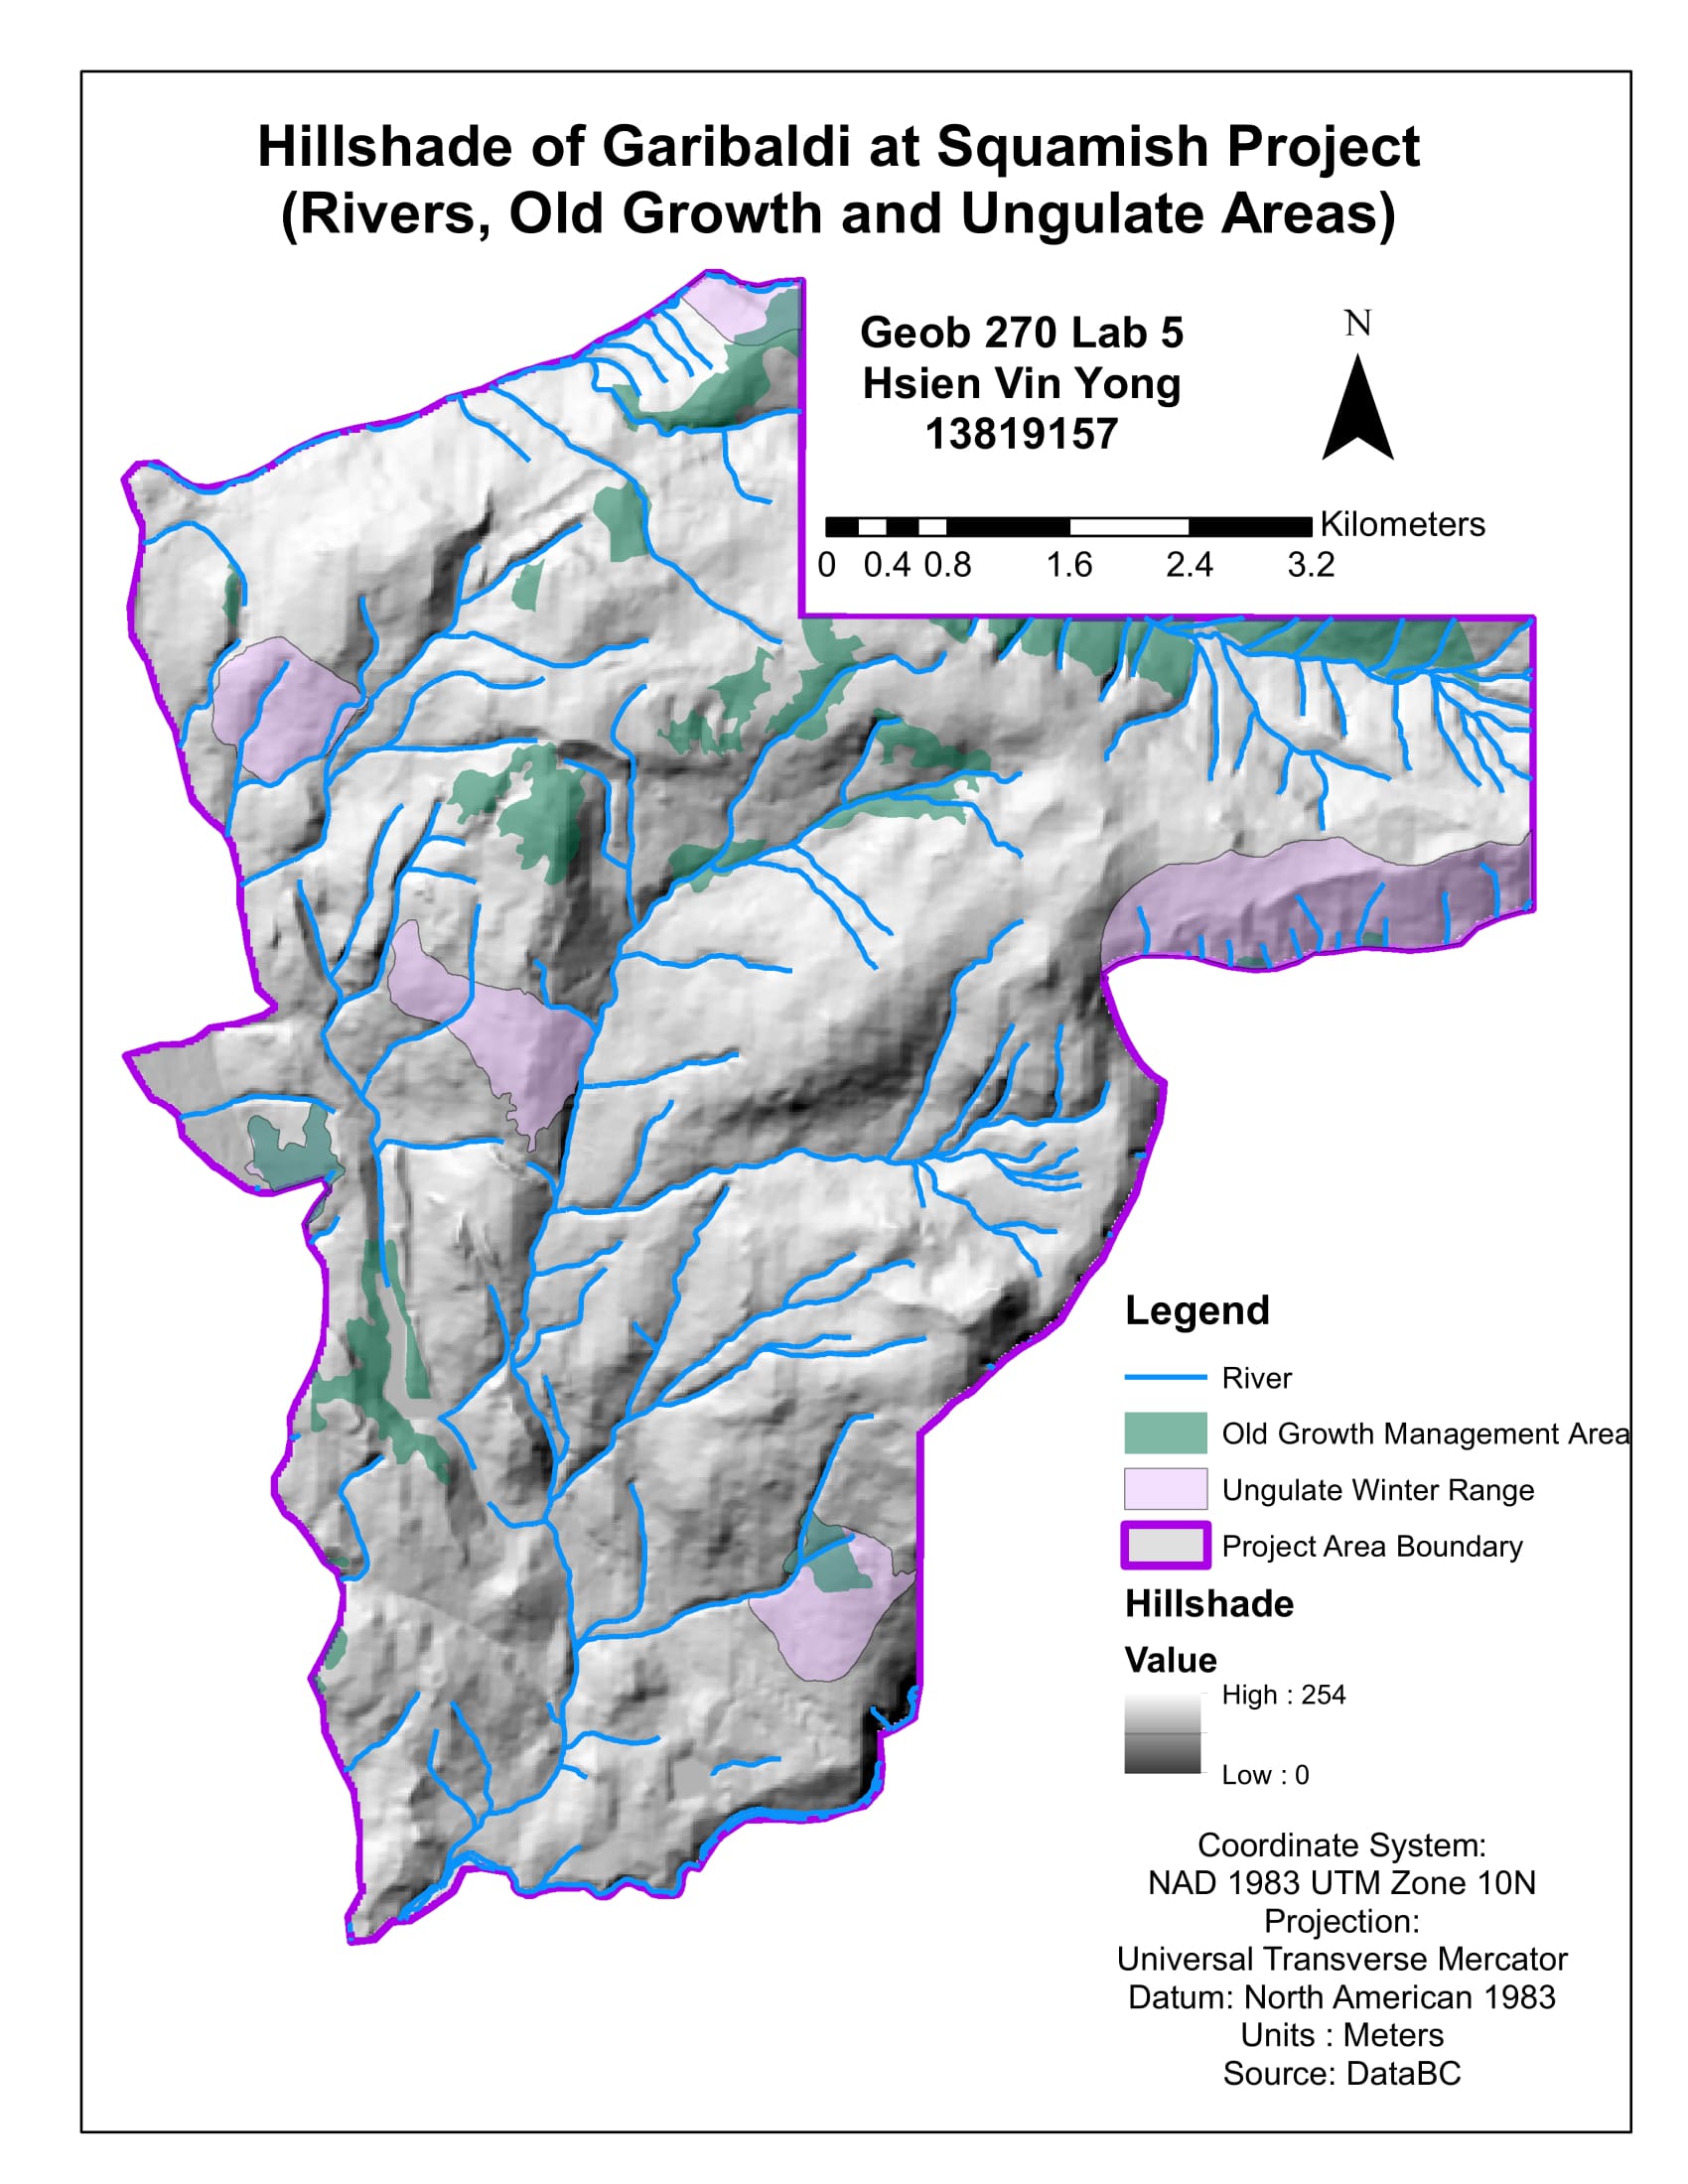
Hillshade of Garilbaldi at Squamish

Garibaldi at Squamish Environmental Assessment


