Where did the time go?! It feels like last week we were anxiously waiting to see what project we had been assigned and soon after, meeting with our community partners to get started. We’ve come a long way since then. With just a couple weeks of the term left, we have finished our infographic and begun to write a our final project report. Reflecting on the past few months, we are very grateful for all of the wonderful learning experiences that LFS 350 has provided us. Right now is perhaps the most exciting (and busiest) time in the course thus far because we are trying to draw meaningful conclusions from our data and synthesize our findings to provide our community partners with a clear representation of our work. Our project has been a long process with multiple community partner meetings, three observations in the community centre, and lots of data to analyze. There have been moments of uncertainty, confusion, and general loss of direction in terms of our project. However, we were able to overcome these through group collaboration and effective communication. At times, such as when writing our academic and experiential review papers, we struggled to make the connection between waste sorting and the main concepts being explored in the course such as food justice. This forced us to think beyond the more obvious aspects of our food system and delve deeper into the connections between food security and food waste. We feel confident that we were successful in our project and will be able to provide our community partners with valuable information on the effectiveness of the new decals on the waste sorting bins.
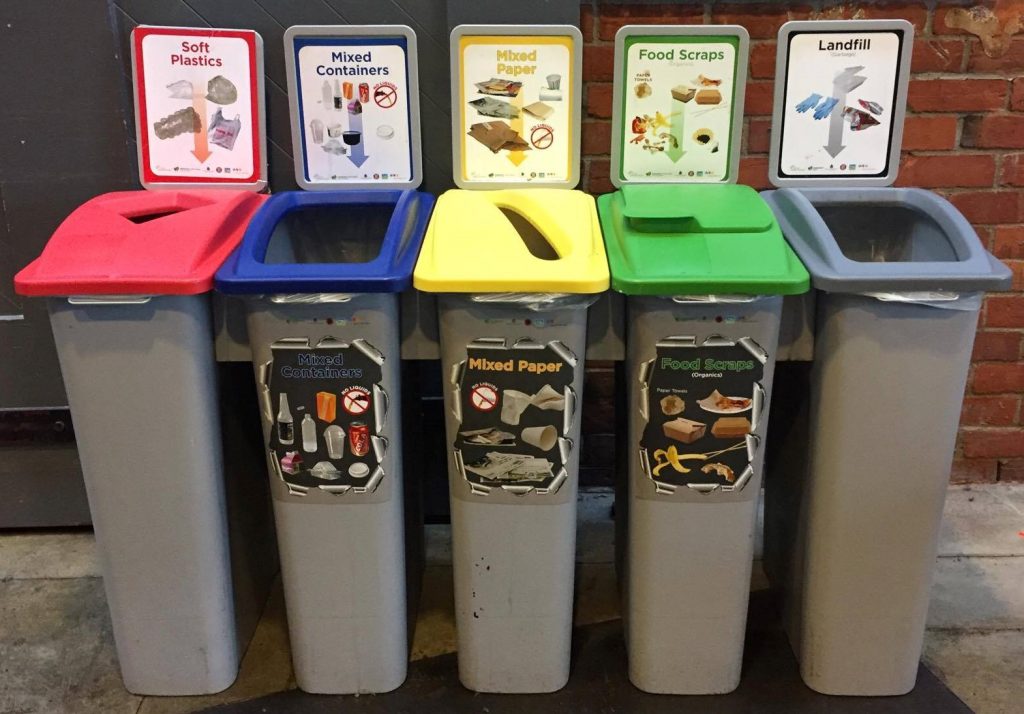 Zero waste stations w/ decals implemented
What
On November 10th we conducted our last observation and we are were very excited to wrap up our data collection and analyze the results. Disappointingly, the sample size collected was much smaller than our first two observations, due to a Professional Development day at the nearby elementary school. However, the informal interviews conducted that day were very successful. The community members we engaged with provided some fascinating insight on whether they believed the decals were helpful with their waste sorting or not. While one participant told us the decals made the zero waste station bins look “more complete”, two others provided feedback that was quite contrasting. One claimed that they didn’t even see the new decals because of how low they were placed and another participant thought the design looked “messy” and the placement of the decals was impractical for adults.
We weren’t completely surprised by the differing opinions about the decals. We heard mixed feedback regarding the decals during our second visit to the community centre, but this most recent visit made the overall assessment of the decals clearer to us. After analyzing the last observation with with previous data, we came to the conclusion that the decals were not effective at improving waste diversion at the Roundhouse Community Centre.
So What
Our findings were crucial to the purpose of our project and thus we’ve deemed the finalizing of our data our moment of significance. The project’s objective was to determine whether new waste sorting signs would aid in a Vancouver community’s waste diversion, and unfortunately, we discovered they were not effective during our observations. Statistical analysis of our gathered data shows the following:
- The newly designed decals had no significant effect on the waste sorting behaviour at Roundhouse Community Centre.
- There was no significant difference between the two main age groups (adults vs. children & youth). Furthermore, we found that the
most commonly sorted waste item is food, which is the 3rd most incorrectly sorted item, as well as food containers (both plastic and compostable). Themost commonly incorrectly sorted items are plastic bags, food, paper towels/napkins, candy wrappers, and pop cans.and pop cans, both with 0% correct rate.
This was both surprising and significant for us to note since some of these incorrectly sorted items belong to one of the three bins we were testing with the new decals. Some widely used items such as paper towel & napkins, plastic wraps, only had 50%-60% correct sorting rate and other items such as receipts, wooden chopsticks, and liquid are were almost always thrown into landfill without hesitation. Although there were many community members who expressed positive sentiments regarding the decals that the decals were helpful in the interviews, these opinions were coupled with some negative reviews and overall data that showed the decals may not be effective. which did not show that they were effective in improving waste sorting habits. These results may be disappointing to our community partners but we feel as though there’s a positive side to our group’s experience as well. In this regard, finding the results to be unsupportive of the pilot Even though the decals may not have improved sorting accuracy, the suggestions given to us by community members can be used to make decals gives us room to suggest improvements for future projects. It provides us (as well as our community partners and the students they work with next) with specific details and reasons why some people disliked the decals. As such, so that changes can take place and better projects can be created to reach our greenest city action plan goal.
Now that we can reflect on our chosen methods of data collection, we have a few thoughts. We are happy that we used both quantitative and qualitative methods. If we had just collected data on wast sorting accuracy, we would have found out that waste sorting still needs some improvement but we would have never found out why waste sorting may not be accurate. By consulting with the community, we were able to gain insight into why the decals may not be effective. This has really changed our view about engaging with the community. We were surprised by how unique some people’s ideas were. One lady mentioned that she would like to know where her waste is going when she recycles it. We are so thankful fort all the community members who agreed to do an interview and share their knowledge and insight.
Through completion of this project, we recognize the importance of the Asset-Based Community Development framework discussed throughout the term. It is so important to connect with community members before making changing without their input. Our project allowed us to interact with the community in a meaningful way and identify their current assets of waste sorting knowledge. This knowledge, as well as the specific feedback from community members, can be used to make further improvements to the zero waste stations. After reading “Kalnciema Street Quarter in Riga: Food Makes the Place” by Kunda & Meiberga (2015), we learned how a relatively small initiative such as a farmer’s market can have such a profound impact on the connections between local food, culture, and community. Farmers markets have become increasing popular in the Vancouver area in recent years as well, with multiple markets being run throughout the summer in different regions of the city (BC Association of Farmers’ Markets and Vancity Community Foundation, 2013). Because markets attract such a wide variety of individuals and are focused on promoting local food, we think that incorporating a booth educating on waste sorting at markets would be a great way to interact with the public. Education on waste sorting could involve examples of the various packaging being used by vendors at the market to teach people how to sort waste. This would integrate an important aspect of our food system into the everyday lives of human food consumption.
Now What
With the end of the term, LFS 350 presentations, Hubbub, and final exams fast approaching, it’s important we take efficient measures to accurately relay our findings to our class, community partners, and beyond. As we’ve often been told in LFS 350, it’s not so much about our project being successful than it is about what you can gain out of the experience. It is without a doubt that this course and the Put Waste in its Place project has taught our group many new pieces of knowledge and various community project skills. Specific to our project’s findings, we’ve gathered enough insight to understand that‘s some community members are not looking for extra visual help when sorting their waste, but instead are more interested with in-depth understanding of what goes where, and why. One participant interviewed in our final visit to the community centre told us she wished the waste station bins were transparent, that way herself (and others) would be able to physically see what’s already been thrown inside and whether or not they were about to make a mistake with their own waste. Other community members we talked to throughout the term mentioned that making the existing signage larger and more detailed would benefit their sorting habits.
As mentioned earlier, the school nearby played an important role in determining the amount of people at the community centre. A high percentage of children and youth we observed at the waste station sorted their items incredibly well – a result we think may be attributed to their early exposure to waste diversion in school. Perhaps, initiatives in school could invite parents to participate in learning about waste diversion or somehow incorporate interactive activities that students can take home to complete. This would also alter which demographic of the population future projects would target since the younger generation understood waste sorting and having the signs placed lower may be redundant. We were expecting the results between children and adults to be vastly different because our community partners had indicated that the new decals were designed for children. However, two-tail t tests performed on the two age groups showed a P-value of 0.81 for data gathered after new decals were put up and a P-value of 0.47 for data of the three observations combined, indicating that there’s no significant difference between two groups. Therefore, the decals didn’t cause a positive or a negative effect on waste sorting performance for any age group.
This project has changed our thoughts about waste diversion. It is not as easy as posting a new sign on a bin in order to improve waste sorting accuracy. Waste diversion is a complicated process that involves the people who throw away their waste, as well as the people and resources to pick it up and sort it. Perhaps the most effective signage may never improve waste sorting accuracy if people do not care about the environment. It is a daunting task to think about how to change people’s hearts but hopefully through projects like these, we can do a little bit by raising awareness and making people think twice before throwing things in the landfill.
With these results in hand, we hope to finish our term off strong with a cohesive report and successful presentations at both our final day of class (November 30th) and at Hubbub#7 (December 2nd). We were incredibly grateful for the opportunity to collaborate with CityStudio and the City of Vancouver to delve deeper into one of our group’s passions – sustainable futures through small, yet impactful environmental acts such as waste diversion. We’ve learned a lot throughout the past 12 weeks but somehow it still felt so short! Given the chance In the future, we would love to investigate other possible further regarding initiatives that could be taken towards Vancouver’s Greenest City action plan, but unfortunately for n ow, we’re off to write a report and cram for finals. 🙁
Thanks for reading!
Scenic view taken near CityStudio during one of our meetings
References
Kunda, I., and Meiberga, U. (2015). Kalnciema street quarter in Riga: Food makes the place. Accessed November 20 2016. Retrieved from http://www.ruaf.org/sites/default/files/UAM%2029%20p60-61.pdf.
BC Association of Farmers’ Markets and Vancity Community Foundation. (2013). The Value of Farmer’s Markets in British Columbia: Insights from the Farmers’ Market Toolkit Pilot. Accessed November 25 2016. Retrieved from http://www.demonstratingvalue.org/sites/default/files/basic-page-attachments/The%20Value%20of%20Farmers%20Markets%20Report%20Aug%2030.pdf.