
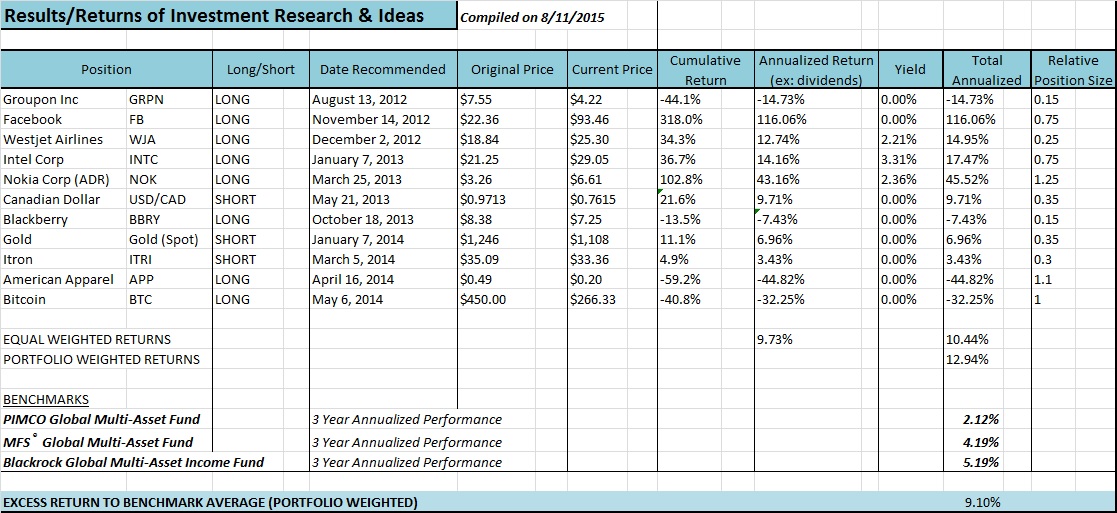
As a capstone to my blog, I have compiled annualized and cumulative returns for the investment ideas that I have written about. I have included both equal weighted and actual weighted results. On the bottom you can see a performance comparison to the Global Multi-Asset benchmarks, as well as the dramatically excess returns that my portfolio has produced. The results assume a holding period beginning at the time of the article being published until present, which is well in-line with my medium to long term themed investment approach.
Given that my portfolio took on a higher level of risk, I can understand the naysayers that may request me to calculate a Sharpe Ratio to prove my skill. However, I would respond by saying that the economic climate determined that a high level of risk was appropriate for the time period quoted (August 2012 – August 2015). And thus, the risk I took on was warranted and my ability to go “risk on” at the right time should be commended.
While the positions I wrote about obviously do not cover the extensively diverse holdings that I have invested in over the years, they do represent a solid historic sample. These results exemplify my “premier advertised holdings”. I am happy to report that these premier holdings absolutely demolish their benchmarks. Even with investments gone politically sour such as American Apparel. See results below.
This will likely be my last post for a long time as I have accepted a new full time role that will inhibit my ability to write about the markets. Enjoy – and as always please do get in touch should any questions or comments arise. My updated email address is: davidbernstein.MBA@gmail.com
 Follow