Investment Performance

As a capstone to my blog, I have compiled annualized and cumulative returns for the investment ideas that I have written about. I have included both equal weighted and actual weighted results. On the bottom you can see a performance comparison to the Global Multi-Asset benchmarks, as well as the dramatically excess returns that my portfolio has produced. The results assume a holding period beginning at the time of the article being published until present, which is well in-line with my medium to long term themed investment approach.

Given that my portfolio took on a higher level of risk, I can understand the naysayers that may request me to calculate a Sharpe Ratio to prove my skill. However, I would respond by saying that the economic climate determined that a high level of risk was appropriate for the time period quoted (August 2012 – August 2015). And thus, the risk I took on was warranted and my ability to go “risk on” at the right time should be commended.

While the positions I wrote about obviously do not cover the extensively diverse holdings that I have invested in over the years, they do represent a solid historic sample. These results exemplify my “premier advertised holdings”.  I am happy to report that these premier holdings absolutely demolish their benchmarks. Even with investments gone politically sour such as American Apparel. See results below.

Returns

This will likely be my last post for a long time as I have accepted a new full time role that will inhibit my ability to write about the markets. Enjoy – and as always please do get in touch should any questions or comments arise. My updated email address is: davidbernstein.MBA@gmail.com

NCAA Tournament – Statistical Analysis via Exponentially Weighted Indexing

I finished my contract with a real estate investment banking team here in Seattle recently and have been light on the consulting work, so I decided to bring my analytic skills to the completely unpredictable NCAA Men’s Tournament. I know the liking’s of Nate Silver will do a similar analysis, but not only am I developing my own methods, but my model also factors in a slight bit of subjectivity in that I choose the indicators and the weightings of these indicators into my final ranking.

My Method

I included all 350+ NCAA teams in my analysis and chose 10 team statistics which I felt to be the best indicators to predict performance in the tourney. While I definitely included all of the standard ones (Shot%, FT%, Total RB/Game, Steals+Blocks/Game, etc), I excluded a couple of the mainstays and also added a few that most others may overlook (2nd half margin, for example). I then indexed these statistics in order to smooth them out for inclusion in a balanced score card type model – then I weighted the indexed indicators using exponents based on their standard deviation to further smooth and subject to my personal beliefs on the predictive strength of each indicator. Lastly, I multiplied the result so as to effectively add Strength of Schedule and other un-indexed indicators at the proper weight. The result gives me a ranking which I used to fill out my bracket.

So I am sure you are all asking: Given my extensive statistical method, who comes out on top? Surprise, surprise: Kentucky…

While last year my results predicted an extreme level of upsets, for the most part, this year the higher ranking teams will hang around until the end. No huge upsets were predicted, but my model does select a handful of significant upsets in the first round. I have heard that Obama likes the #12 seed vs #5 seed upsets, well according to my analysis it is the #10’s vs #7’s and #11’s vs #6’s which appear to have a high likelihood of upsetting their opponents this time around. A few examples include:

#11 Texas over  #6 Butler

#10 Indiana over #7 Wichita St

#11 UCLA over #6 SMU

#10 Ohio St over #7 VCU

#11 Ole Miss over #6 Xavier

Plenty of other minor upsets were forecast, but no need to bore you with those. The biggest surprises I have are in the West, were I see North Caroline facing off against Arizona in the Elite 8 – with Arizona advancing.

You can follow the progress of my bracket here: http://goo.gl/lutplG

Potential Improvements

I would have liked to factor in travel distance or distance from home into my model, but this would have taken quite some time to tabulate and incorporate – perhaps next year. I can also honestly say that I am not a huge follower of NCAA basketball until March comes around, so I was not able to incorporate some of the more qualitative factors having to do with individual teams.

On the other hand, I would love to team up with an NCAA Basketball enthusiast next year, as I am thoroughly convinced that between my analytic skills and a potential partners qualitative knowledge of the league, we could hit a jack pot if we take our luck to Vegas. So, if you you think you are this person, ping me!

While it only took me only a handful of hours to put this together, last year I was effectively able to predict a relatively large number of upsets – so we will so how it goes this time around.

I have inserted the summarized raw data below, feel free to ping me if you would like to see entire workbook

Data

Bitcoin Economics (for the layman)

deflationary

Without going into too much depth, I would like to publish an image that I put together last year. Essentially, this chart quite succinctly exemplifies the economics of Bitcoin. The only given is that the supply growth will slow according to Bitcoin’s underlying core protocol code. So, IF the awareness of the virtual currency continues to grow internationally, the adoption continues to increase on a global scale, and new commercial accessibility/mass adoption applications continue to be introduced THEN the price could likely move in a trend as seen on the chart. Especially once supply growth halves next July.

Basically, my presumption is that these last three factors are the main influences on demand. While political risk continues to have some merit, the permissive and dare I say “Laissez-Faire” attitude of most governments around the world towards BTC does not seem to be a legitimate concern at this stage.

Hope you enjoyed this brief rant.

Should you invest in #Bitcoin?

As the central banks of the world continue to push forward with QE infinity, there is finally a way to avoid international currency devaluation chaos without speculating on precious metals or rocks as I like to call them. As we all know, the likely result of this aggressive policy will be inflation, if not hyperinflation. But it appears I am already off topic…

What is Bitcoin? If this is a new topic to you then please view these videos which were put together by the expert teachers over at Khan Academy: http://goo.gl/majyrx. I am not going to be providing an introductory lesson on the revolutionary virtual currency, but instead will be focusing more on the advantages of this particular habit changing phenomenon.

In short, it is an uncorrelated asset class which is currently classified as property by the IRS, and allows for cheap, fast, and secure online payments and transactions. As a matter of fact, you can transfer Bitcoin into any major currency in the world for a fraction of the cost a bank would charge. Let us dig into this point a bit further – banks would get 3% out of you on the exchange spread, and then they charge an often substantial fee to transfer the money via a wire. This can all be done in Bitcoin for little to no fee. There are a lot more benefits and draws to Bitcoin then just that, but this is a good start.

Given the crazy and outlandish behavior of our international governments; from the debauchery of American congress to the land grabbing Russian leaders – it may be to our benefit to build a stake in a currency which is decentralized and not controlled by a governing body with excessive ulterior motives. Interestingly enough, the US government seems to be leaning towards supporting Bitcoin. They appear to be desperately ready to stand behind any new industry which offers the potential for job and earnings growth.

My last point on the benefits of holding Bitcoin refers to its deflationary tendencies. While the US dollar loses value every year due to increases in supply, among other catalysts – Bitcoin’s supply increases at a set rate which decreases over time and caps out at 21 Million. As a result of this, the currency is disinflationary and appreciates in value as opposed to most commonly used currencies which are inflationary and tend lose value over time. See this link for more detail on the controlled supply: http://goo.gl/nohUvS. While Bitcoin’s supply does increase, the demand for the coin has outpaced this increase in recent history which has resulted in rampant appreciation. Considering that only a small portion of the world is aware of this currency and has access to purchase Bitcoins, I anticipate that demand will increase dramatically as commercial accessibility and application ramp up – which I might add, is happening as we speak. What does all of this spell out? Short term, medium term, and long term appreciation.

So there are the facts – should you invest? Well at the very least, it is a good diversifier with potential for massive returns, but there are also many risks involved with an investment in Bitcoin. So it really just depends on your risk profile. I certainly have built my stake and am exceedingly bullish on the underlying technology, but then again I am a serious risk seeker. If you are looking for a high risk/high return investment, then this may be right for you. If you cannot stomach the risk, then perhaps just stick with index funds and bonds.

If you enjoyed this article please feel free to donate Bitcoin. I am also available to complete consulting projects and am willing take requests for research projects in return for bitcoin.


The next potential takeover target: American Apparel

While many analysts have chosen to focus on American Apparel’s (APP) extensive debt burden, I am taking a contrarian viewpoint on this company. With over $600 million in annual revenues, American Apparel could be the next big takeover story.

Although American Apparel is currently undergoing extensive restructuring and another equity issuance, the company has tremendous brand exposure and it has done an excellent job extending its platform internationally. While further restructuring would be necessary in the case of an acquisition, my research shows that the acquirer could potentially receive significant synergies. According to my model, incorporating these synergies could produce a valuation for American Apparel over $2 per share instead of the measly $0.50 that the firm is currently trading at. While earnings have been negative recently, the company trades at .15 times sales, showing just how little confidence investors have in a turnaround. But as many great investors say, it is time to buy when most others are afraid to do so.

The assumptions included in this synergy estimate are a base case reduction in cost of goods sold due to increases in scale and lowered operating expenses due to the consolidation of two companies SG&A expenses, among other operating costs. Other synergies could be achieved through restructuring the lease agreements or perhaps moving locations to more up and coming areas as opposed to renting prime real estate. In the end, this is another example of a heavily-shorted stock where short sellers have forgotten to take a close look at the contrarian argument. It sure seems that the folks on the short side of this will feel some pain in coming months.

The list of potential acquirers is endless but would likely include retail apparel giants which are currently under-leveraged or which have a less then ideal amount of debt. The acquisition of American Apparel could create an opportunity to leverage operations which could have exponential upside. A couple of companies that come to mind as potential suitors are H&M (HNNMY) and Gap (GPS). Both of these companies have huge retail apparel businesses and relatively low debt positions. Both companies could also purchase American Apparel without too much trouble and both would likely reap massive synergies from this acquisition. Another possibility would be that a private equity firm executes a buyout to take American Apparel private in order to restructuring and cut costs. Even an activist hedge fund could establish a large enough position in the company to get a seat on the board and force change. Anyway that you look at it, I see potential for strong upside for a large buyer.

The risks involved here include the fact that American Apparel may not be willing to be taken over. I have heard many interesting stories about the company’s CEO, Mr. Charney, and I am not sure how willing he would be to give up control. On the other hand, a hostile takeover would certainly not be out of the question, considering that the company’s entire equity float is under $100 million.

I feel confident that American Apparel will have a successful turnaround, especially considering  the synergy potential that the company may offer to the right acquirer. Synergies this extensive will not be left on the table.

If you enjoyed this article please feel free to donate Bitcoin. I am also available to complete consulting projects and am willing take requests for research projects in return for bitcoin.


Itron (ITRI) Rating: Underweight

Good day friends and followers:

I completed a fairly intensive research project for a local investment manager here in Seattle over the past couple of weeks and I have decided to publish my research. Please see the report below on Itron (ITRI).

Itron Investment Thesis

Overview

As the world moves toward enforcing a more energy efficient environment, innovative new products have emerged which give users and utility operators the capability to monitor resource usage more accurately and in real time. One of these innovations, appropriately titled the “Smart Meter” offers the opportunity to more effectively manage energy usage and also provides complete transparency as to how much of a particular resource is being used. Additionally, these smart meters can collect data and provide analytics which can help lead to a more sustainable world.

Governments around the world are rolling out mandates which establish the requirement for smart meters to monitor energy usage. Along with this, companies large and small are battling for these contracts. Based within the Pacific Northwest region, Itron is an international leader in providing metering solutions for electricity, gas, and water utility companies. Their goal is to continue to innovate their product and service mix to more efficiently “Analyze, Manage, & Measure” utility output and consumer usage.

Financial Analysis

Over the past 5 years Itron has underperformed its competitive set even though they have continued to grow their business. Competition in the industry has picked up as giant conglomerates such as General Electric enter the field. Furthermore, the sales cycle has slowed due to economic uncertainty and other delays. While Itron is still an international leader in the industry, their earnings have been extremely volatile and they have announced annual losses in 3 of the past 5 years. The company’s 2014 guidance points to another soft year, and will likely be their fourth consecutive year of decreasing sales.

Another area of concern is their buildup of intangible assets and the firm’s penchant for asset write-downs. Itron declared an asset impairment of over $500 million in 2011 and of $137 million in Q4 2013. While they still hold intangibles and goodwill of close to $750 million on balance sheet, their pace of amortization for these assets has slowed and future write-downs are limited although still a looming threat.

On a brighter note, Itron’s restructuring process continues to show glimmers of hope and there is an expectation that margins will bottom out in early 2014 if they have not already.

Valuation

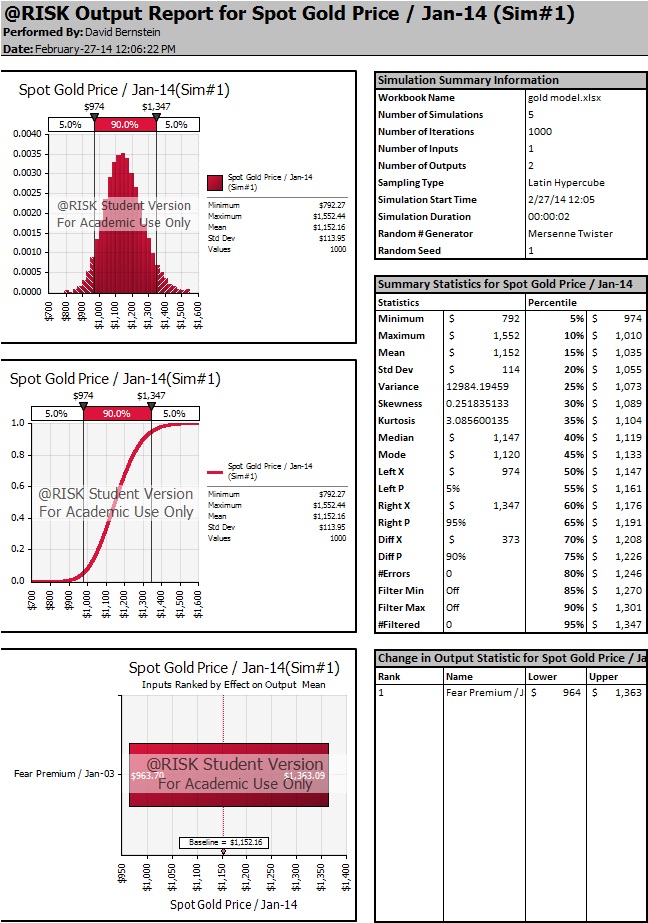
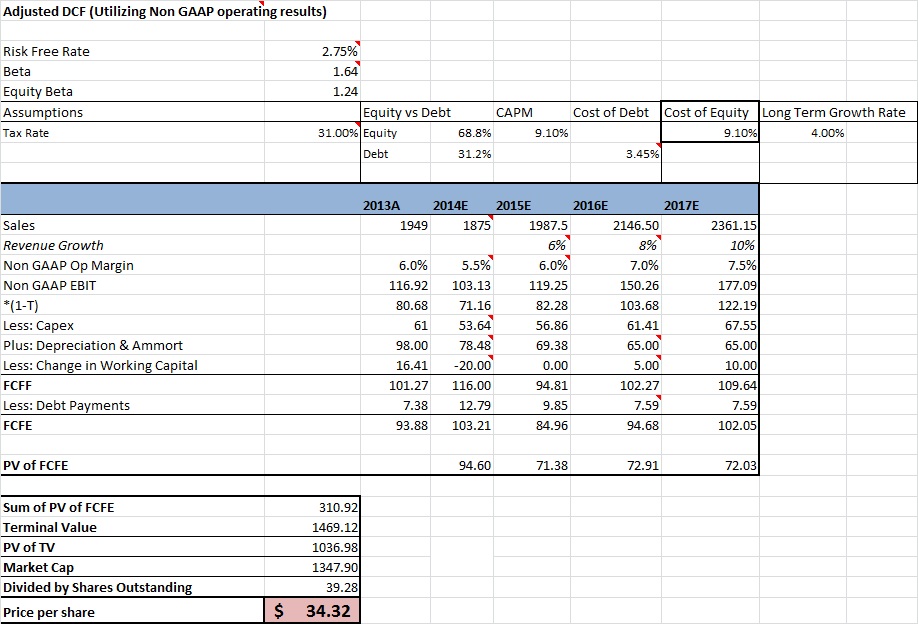
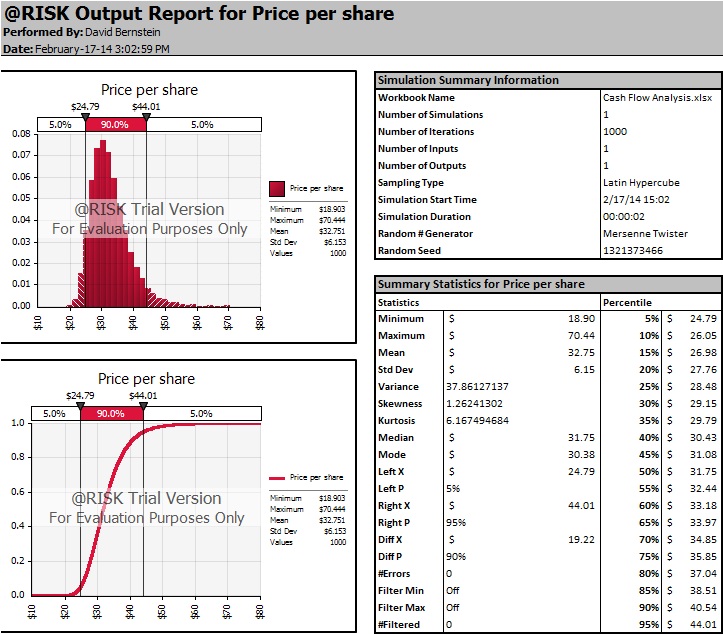
Using Itron’s published Non-GAAP operating income, historical financials, and forward guidance, I developed a discounted cash flow model which values Itron at $34.32 per share. The Non-GAAP operating income provides a more normalized picture of the firm’s cash flow potential and pure business value. Since the long term growth rate was the biggest assumption in the model, I completed monte carlo analysis with a normal distribution on this growth rate. The results show a positive skew, with much more upside then downside, and a 90% probability range of $24-$42.

In reviewing Itron’s multiples compared to their competition, I first calculated the Price to Tangible Book Value due to the firm’s substantial amount of intangible assets and goodwill. Using a 5x multiple which was the mean of the comp set, I arrived at an expected value of roughly $16 per share based on Itron’s current tangible asset balance. However, this must be taken with a grain of salt since this expected value essentially only generates a floor for Itron’s equity value.

The EV/EBITDA multiples show the other side of this story. Since the current EBITDA is negative, I used my projected adjusted EBITDA for 2014 and 2015. The FY1 and FY2 EV/EBITDA multiples for the comp set put the expected value of Itron shares close to $50. If Itron’s margins do in fact bottom out in 2014, and the firm begins to show some revenue growth, their shares could be valued more in line with the rest of the comp set.

While we are discussing upside, I may add that Itron also has the potential to continue to innovate and develop new products. Additionally, they are still looking to realize some synergies from their recent acquisition and their board continues to approve share repurchases which have helped to beef up earnings to some extent.

Investment Thesis

From this research, I expect Itron shares to continue to UNDERPERFORM both the market and the firms competitive set in the immediate term. While the company’s backlog of orders continues to grow, their slow restructuring process has decreased margins. Furthermore, sales and decision cycles are continuing to take longer than expected. There is also a chance that they will be plagued with another asset impairment charge at some point in the future. Due to the companies distress, I am placing an 8x EV/EBITDA multiple target to their 2014 adjusted EBITDA to get a price target which is in line with my discounted cash flow model. Near term price target: $32.00

In the longer term, I see potential for Itron to recover lost ground. They are an industry leader with strong international exposure in a field that is expected to see tremendous growth over the next 5 years. Once the firms restructuring is complete and signs emerge that sales growth has returned, Itron may be valued more in line with its competitive set. This could cause the stock to rise significantly. Considering this, Itron may offer excellent investment potential and could be a strong value if one is able to enter near the bottom of the business cycle which seems likely to occur sometime within the next year.


If you enjoyed this article please feel free to donate Bitcoin. I am also available to complete consulting projects and am willing take requests for research projects in return for bitcoin.


Gold Valuation: V2

Considering the recent run-up in gold I have decided to re-evaluate the model I built in early January. Due to the uncertainty and multiple factors involved in assessing the fair value of gold, I have decided to build a normal distribution around the “Fear Premium” which I mentioned in my previous post. Additionally, I would like to change the name of this metric to the “Additional Intangible Value” which holding Gold can bring as an investment since it accounts for more then just fear. To properly account for this “Intangible Value” I am assigning a mean rate of 2.5% with a standard deviation of 1%.

The results of this seem to be in line with current spot prices of gold. This study produces a 90% expected value range of $974-$1347. If this model is in fact accurate, gold’s price rebound may be short lived with another sell off potentially in the cards. Please see Monte Carlo simulation results below.

If you enjoyed this article please feel free to donate Bitcoin. I am also available to complete consulting projects and am willing take requests for research projects in return for bitcoin.


Fair Value of GOLD

Yes, I know, Gold is impossible to value, too many factors involved, too complex…. Yadda, yadda, yadda…..

Well, without too much time, stress, or serious thought, I feel pretty good about having completed a fairly reasonable valuation of Gold. I could write on the topic for days and days, but am not really properly incentivezed to do so~

However, I will explain my methodology. I took gold prices from the most recent economically stable time period (before gold went vertical) and compounded it by a “gold inflation rate” equal to actual US inflation + increase in US money supply as these were the 2 clear catalysts for increasing gold prices over the past decade. I then tacked on a fear premium which ranged from 0-2% per year (just to keep the gold bugs happy), and completed a monte carlo simulation on this number since it was the only assumption used. My results show a mean price for gold of $988 and a 90% probability that the fair value of gold according to my methodology rests between $922 and $1058.

And then there is the macroeconomic view of gold, which is absolutely horrible, but I will let the economists out there cover this area.

In other words, gold likely still has another 10% to 20% to fall before a bottom can even somewhat rationally be discussed.

Please see model and charts below and feel free to reach out if you have any questions.

If you enjoyed this article please feel free to donate Bitcoin. I am also available to complete consulting projects and am willing take requests for research projects in return for bitcoin.


Value in the Russian markets and potential M&A deals

Investing in Russia

During my groups debate on which project to take on for our M&A pitch book, we all prepared ideas which ended up leading to an excellent conversation when it came time to choose. While we did not end up choosing my proposed topic, I felt that it was a reasonable enough topic to write on for my supplemental analysis. In reviewing world markets, it seemed that most are well valued and some are even inflated (see US) due to accommodative monetary policy. Bottom line being that it was difficult to find huge value in the markets in current times.

After reviewing price to earnings ratios for indices worldwide, I was able to find a region which still has good value. Of course, this excellent value comes accompanied with extensive political risk that scares many investors off. The country of Russia currently has a very attractively valued stock market. Many companies are trading at less than 5x earnings and less than 5x free cash flow as well. While I have heard many horror stories related to investing in Russia, after a bit of research I was not surprised to find that many successful deals occur as well.

While Russia was a member of the original BRIC emerging markets countries, their growth as measured by GDP and ROI has lagged that of the other 3 countries in this classification[1]. In this sense, investments in Russia have been a relative disappointment. However, I feel that Russia still has long term potential for those that are patient and this is evident through their seriously low valuation when compared to other regions of the world. In addition, earlier in 2013 Putin made commitments to welcome international investment into Russia[2]. He realizes that many are weary of the political risk of such investments; however the country is going to great lengths to evade this poor reputation.

Where to invest/potential M&A deals

Oil & Gas

I have highlighted two sectors which I feel offer good potential investment opportunities for an international company looking for expansion options in Russia. The first is obvious, Oil and Gas. As an international leader in Oil and Gas production, this is by far the strongest business segment in Russia. Gazprom would be the first option, although it may be difficult to make an acquisition of Gazprom due to extensive political and government ties into the company. Per the company website, the Russian government owns a slight majority in the company with a stake of 50.02%[3].

Lukoil would be the other Oil giant in Russia, and this company is primarily owned by insiders which lessen the political risk. However, this does not mean a takeover would be easy. Russian government has been known to cause a ruckus in large foreign investment deals, even if they are not a majority shareholder. Lukoil is currently trading at P/E ratio of 4.42. This is an excellent value for any company looking to expand into Russia.

As far as potential suitors go, I would claim that a Chinese CNOOC, a British BP, or maybe even a Chevron or Exxon Mobile would have good incentive to look into a takeover of one of the Russian giants. Chinese CNOOC would probably be the most likely fit, as they are known for their takeovers and acquisitions of other regional Oil and Gas firms (see Nexen). In addition, they are a powerful regional neighbor of Russia’s and geographically a Russian acquisition would seem to make sense. If the acquirer were to be a North American firm, it may be a good idea to consider a stock deal or part stock part cash deal due to the inflated US markets. A CNOOC deal would more likely be a cash deal.

Airlines

Another sector which may hold some potential for a takeover would be the airline industry. Investors have been warming up to this sector in the last year or so, as growth numbers for fliers are finally outpacing the extensive concerns of profitability in the often troubled sector. As international airlines continue to consolidate, the low valuations in Russia could cause some of the bigger airlines to look into this region. Once again though, the Russian government owns 51% of this airline, so this may complicate things.[4] Seeing is it is one of the oldest airlines in the world, the Russian government may not want to divest.

Conclusion

While Russian companies are currently available at extremely attractive valuations, the political control of the nation may cause some to look other places for investment. However, for the right team, with the right skills and connections, they are some very lucrative deals waiting to happen. In my opinion it is only a matter of time before this Russia hones investment and investment hones Russia.

If you enjoyed this article please feel free to donate Bitcoin. I am also available to complete consulting projects and am willing take requests for research projects in return for bitcoin.


Blackberry Arbitrage & Equity Value

With 4 interested parties now in the game, this story is developing rapidly…

Thus, I decided to prepare my own little quick and dirty valuation of the firm (I would have done a more thorough job, but currently have a serious lack of time due to a fairly intensive MBA program). To determine the lowest possible deal value, I decided to make some estimations and calculate an adjusted book value of equity and then bring it to a per share level.

Forecasting from Blackberry`s Q2 report which was just released at the end of September, I used the trends showing from the last 5 quarterly reports to estimate current levels of Assets and Liabilities to get me to a book value of equity. Taking relatively large deductions for depreciation and writing down 20% of intangible assets allowed me to get to the conservative estimate of $11.50 per share. This is my current price target for Blackberry, and I think the bidding is likely to get to this level. I could also see a much higher offer being made, especially once synergies are taken into consideration.

Disclosure: I opened a long position on Blackberry with options earlier this week in order to take advantage of this arbitrage opportunity. I plan on adjusting this position (buying or selling) as more news come out.