I finished my contract with a real estate investment banking team here in Seattle recently and have been light on the consulting work, so I decided to bring my analytic skills to the completely unpredictable NCAA Men’s Tournament. I know the liking’s of Nate Silver will do a similar analysis, but not only am I developing my own methods, but my model also factors in a slight bit of subjectivity in that I choose the indicators and the weightings of these indicators into my final ranking.
My Method
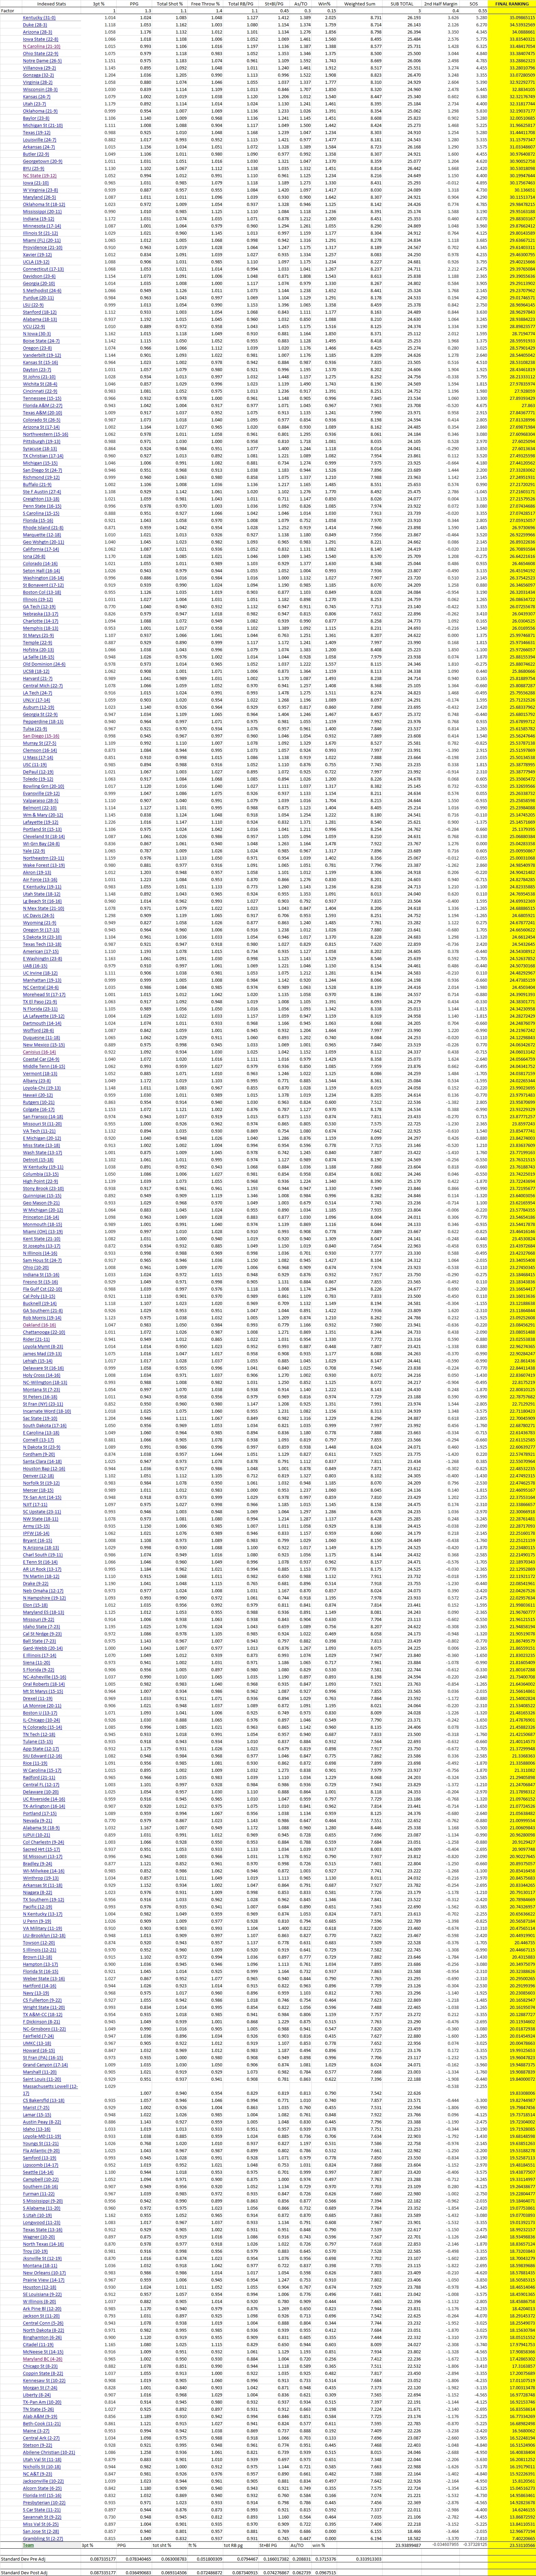
I included all 350+ NCAA teams in my analysis and chose 10 team statistics which I felt to be the best indicators to predict performance in the tourney. While I definitely included all of the standard ones (Shot%, FT%, Total RB/Game, Steals+Blocks/Game, etc), I excluded a couple of the mainstays and also added a few that most others may overlook (2nd half margin, for example). I then indexed these statistics in order to smooth them out for inclusion in a balanced score card type model – then I weighted the indexed indicators using exponents based on their standard deviation to further smooth and subject to my personal beliefs on the predictive strength of each indicator. Lastly, I multiplied the result so as to effectively add Strength of Schedule and other un-indexed indicators at the proper weight. The result gives me a ranking which I used to fill out my bracket.
So I am sure you are all asking: Given my extensive statistical method, who comes out on top? Surprise, surprise: Kentucky…
While last year my results predicted an extreme level of upsets, for the most part, this year the higher ranking teams will hang around until the end. No huge upsets were predicted, but my model does select a handful of significant upsets in the first round. I have heard that Obama likes the #12 seed vs #5 seed upsets, well according to my analysis it is the #10’s vs #7’s and #11’s vs #6’s which appear to have a high likelihood of upsetting their opponents this time around. A few examples include:
#11 Texas over #6 Butler
#10 Indiana over #7 Wichita St
#11 UCLA over #6 SMU
#10 Ohio St over #7 VCU
#11 Ole Miss over #6 Xavier
Plenty of other minor upsets were forecast, but no need to bore you with those. The biggest surprises I have are in the West, were I see North Caroline facing off against Arizona in the Elite 8 – with Arizona advancing.
You can follow the progress of my bracket here: http://goo.gl/lutplG
Potential Improvements
I would have liked to factor in travel distance or distance from home into my model, but this would have taken quite some time to tabulate and incorporate – perhaps next year. I can also honestly say that I am not a huge follower of NCAA basketball until March comes around, so I was not able to incorporate some of the more qualitative factors having to do with individual teams.
On the other hand, I would love to team up with an NCAA Basketball enthusiast next year, as I am thoroughly convinced that between my analytic skills and a potential partners qualitative knowledge of the league, we could hit a jack pot if we take our luck to Vegas. So, if you you think you are this person, ping me!
While it only took me only a handful of hours to put this together, last year I was effectively able to predict a relatively large number of upsets – so we will so how it goes this time around.
I have inserted the summarized raw data below, feel free to ping me if you would like to see entire workbook