Infographic:
Moment of Significance:
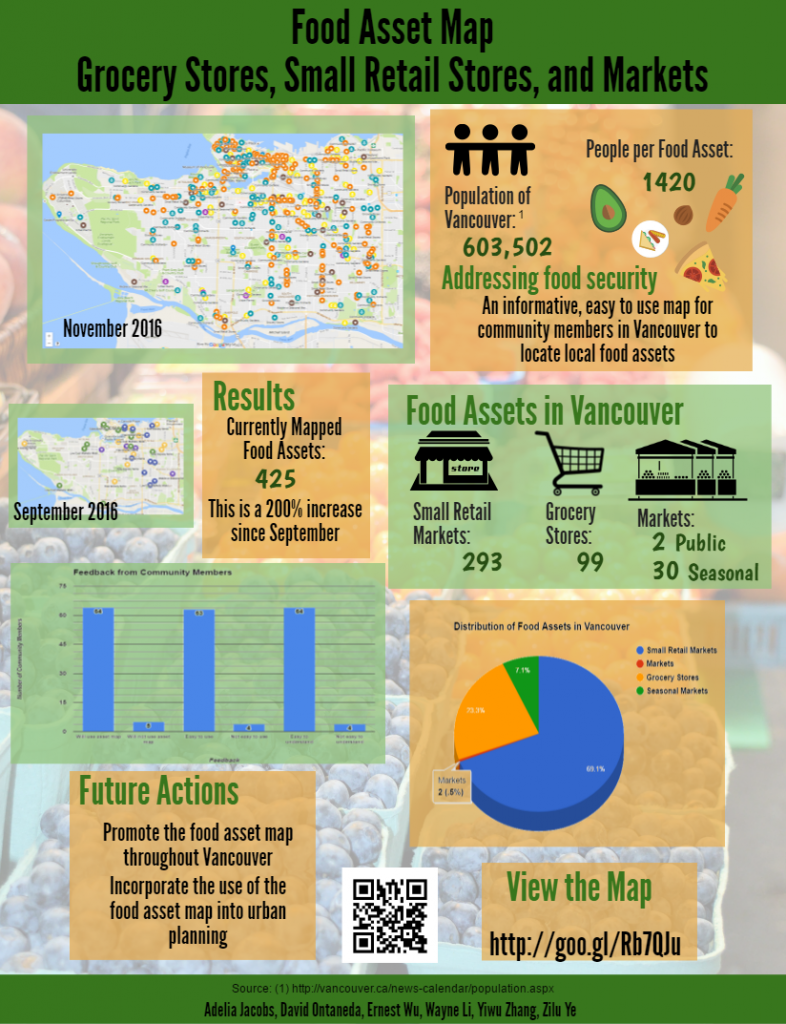
What?
Over the course of this term, we as a group have experienced a rollercoaster of emotions and uncertainty, however, at this point as we near the end of the term, we feel as though it has been incredibly rewarding. From being assigned to groups not knowing our projects, to completing our data collection and map trialing with community members, there have been many obstacles that we collectively managed to navigate. Moments such as learning about our project at the info session with Vancouver Coastal Health, and coordinating the trialing of the map.
So What?
The moment of significant change activity showed our group how we were able to cope with uncertain circumstances, such as learning about all the assets we were to map for the project, working out times to trial the map with community members, and planning out our infographic and final report. Through the graphs of significant change we also realized that each group member had a different view towards emotional highs and lows with each significant moment. Even though we each had these different views, we were able to work effectively throughout the term and finish set goals on time.
The low point in our project was the trialing of the map with our community partner. Due to our schedules and the limited availability of time slots at the community event, we were initially unable to make any of the trial events as a full group. Facing uncertainty and pressure from our set goals, we came up with a plan to send one of our group members to one of the events. This was a great learning experience for us in terms of planning as Schulman mentions, “without a certain amount of anxiety and risk, there’s a limit to how much learning occurs” (Shulman, 2005). The trial with community members went well and we received good feedback about the food asset map.
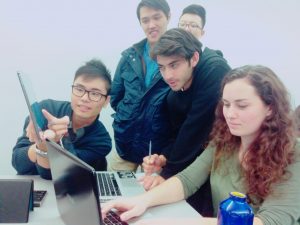
Working through our infographic, we each had our own idea on how the infographic should look. However, we were able to compile all our ideas and effectively displayed all of the important information we wanted to present. During this process, each of us received much feedback from one another’s various perspectives.
Now What?
With the data we collected from both quantitative food assets and qualitative community member feedback, we aim to complete our infographic presentation as well as write up our final report. Future considerations regarding the constant updating of the map may need to be implemented, and can be accomplished by future LFS 350 students. This is important an up to date map can best be utilized by the community members we are trying to assist.
In regards to completing our presentation and final report, we aim to distribute the work over the last 2 weeks of class as to avoid rushing near the deadlines. Constant communication between group members is important in keeping up to date with our schedule. Work distribution will be discussed through these conversations and should any group member have issues regarding their portion of work, then we will further discuss and arrange other plans. Time is tight especially near the end of term and management of time is extremely important with each of our busy schedules. However, we must face these challenges and finish well in this course after investing so much hard work into our project thus far. I believe we are all committed as a group to finish well and end with a sense of accomplishment for our work with the community.