
QUANTITATIVE DATA CLASSIFICATION
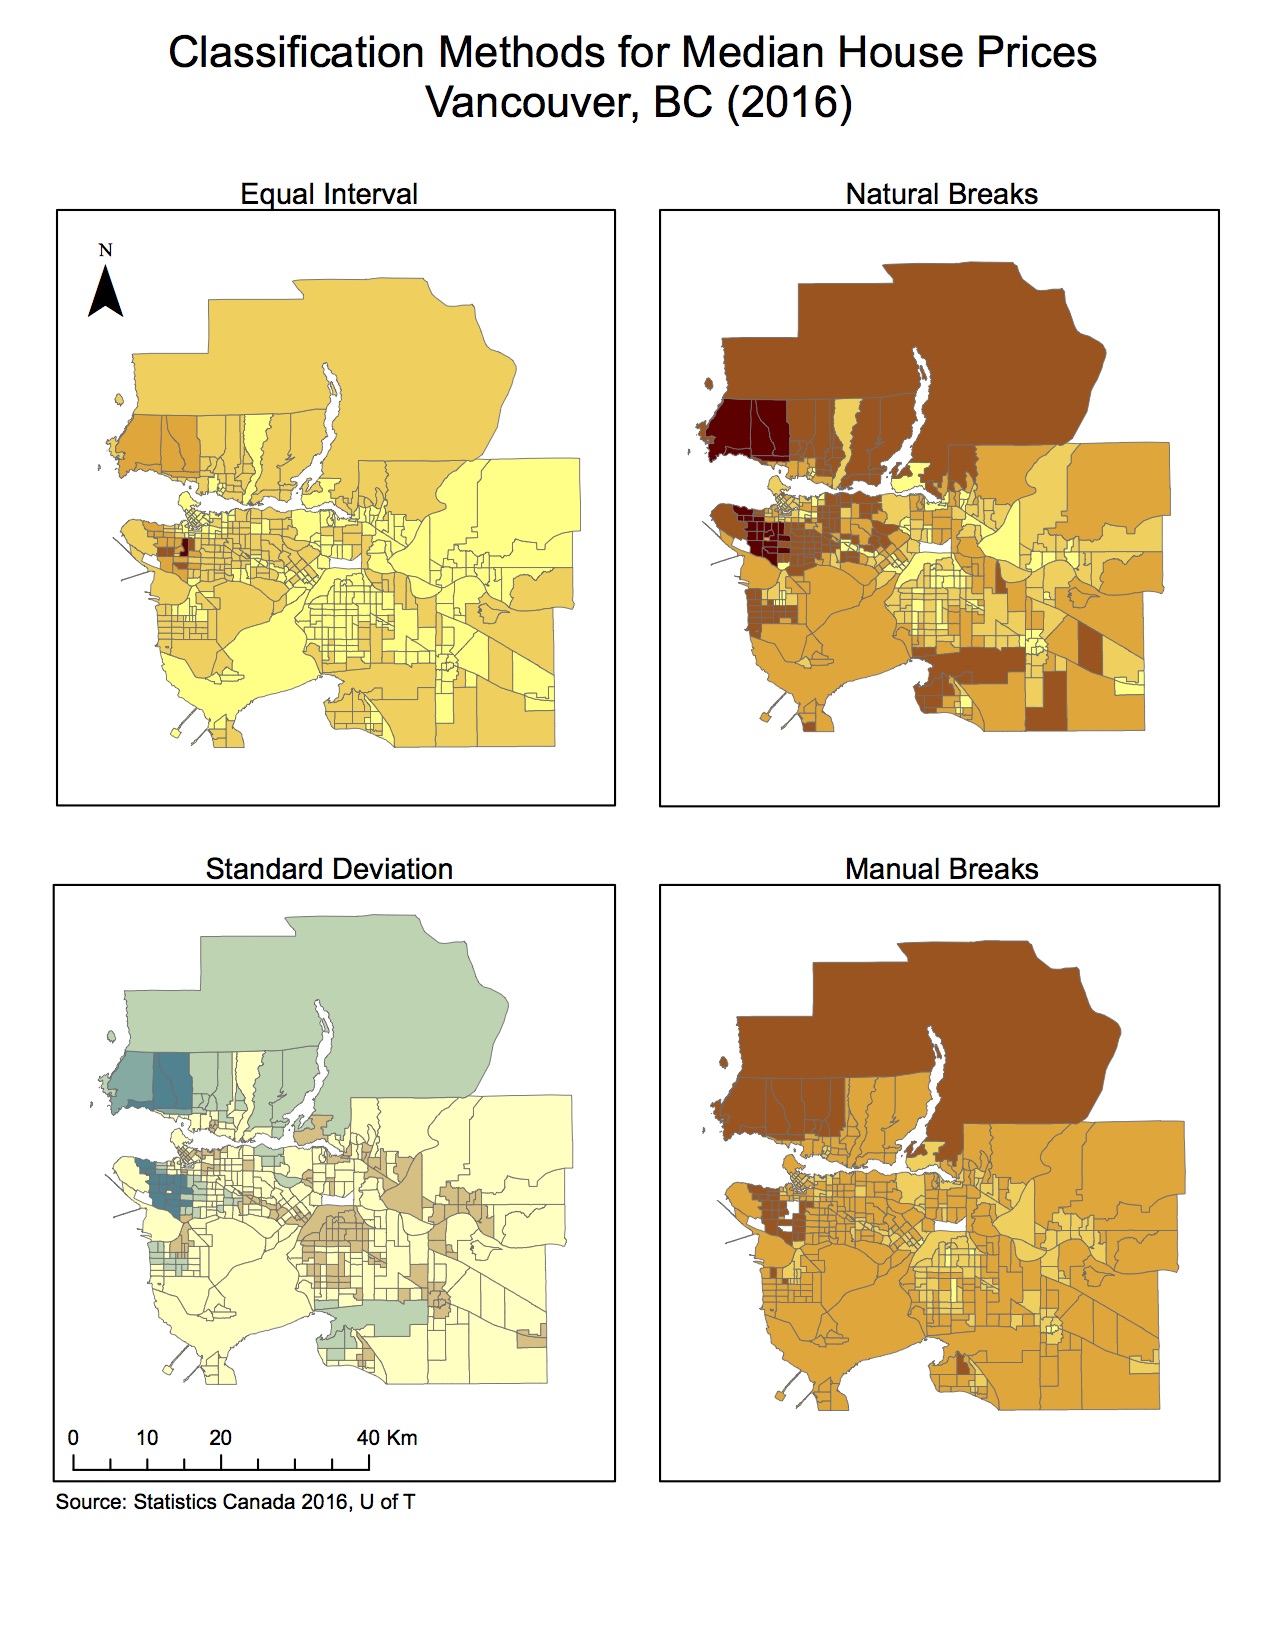 If I am a journalist putting together maps of housing cost in Vancouver, I would use the Natural breaks method for my audience because it gives the most accurate and easily understandable representation of the median house prices. However, if I were a real estate agent preparing a presentation for prospective home buyers near UBC I would probably use the equal interval classification method because it makes areas look less expensive than they actually are; therefore, people will be more willing/likely to buy these expensive homes. Technically there are no ethical implications to using this method as opposed to the natural breaks method because you, as a real estate agent, are not changing the data; you are only using a different classification method that works in your favour.
HOUSING AFFORDABILITY
Affordability is measuring the ratio of the housing cost over the median household income. It’s a better indicator of housing affordability than housing cost alone because some people may have higher incomes than other people but still have the same shelter costs. The 12th Annual Demographia International Housing Affordability Survey in 2015 provides us with housing affordability rating categories, which separate the data into levels of affordability/unaffordability depending on median multiple. Because data was collected by professionals in urban planning, the data can be trusted. Although the maps provided show users that Vancouver is severely unaffordable, it is important to note that an unaffordable city does not mean an unlivable city. Affordability only tells us about a population’s ability to pay for housing whereas livability relies on multiple factors such as economic status of a city, social status, education, etc.
ACCOMPLISHMENT STATEMENT
Understood the different methods of classifying data: manual breaks, natural breaks, equal interval, and standard deviation in order to represent how each of these methods led to different looking maps.