SonaR
A Map of Orange Cell Phone Activity in Paris
https://vimeo.com/157655906
Year Completed: 2016
Location: Paris
Media: Video
Authors: Catherine Ramus, Cezary Ziemlich, Pascal Taillard, Marc Brice, Orange Labs
Information+ Exhibition June
16–17, 2016, at Emily Carr University of Art + Design in Vancouver, BC, Canada.
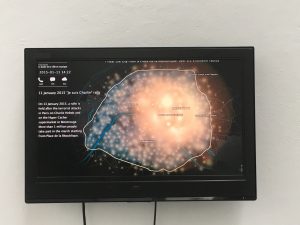
The SonaR project visualizes the Orange cell phone activity in Paris in three different days: a normal day, “Je suis Charlie” Rally Day, and New Year’s Eve. Each point on the map represents for a cell tower. The brightness of that point shows the level of activity of that cell tower. The data is collected from Orange, a mobile phone operator in France.
On January 11, 2015, “Je suis Charlie” Rally Day, 3.7 million people gathered on Place de la Repbulique and marched towards Place de la Nation in tribute to those killed by terrorists. We can easily find photos, videos and news reports of this rally. However, the video of SonaR project recorded this event from a different angle. We can see from the video that before 8:30, only very few people used their cell phone. Then the cell phone activity gradually increased in the morning but is still evenly distributed, which is not surprising because that day is Sunday. People start gathering at Place de la Repbulique from noon. At 3 pm, cell phone activity reaches the climax. After that, the brightest part moved towards Place de la Nation and disappeared gradually at 7 pm.
This video only uses the data of Orange cell phone users, so the activity of other mobile phone companies is not shown. The parks, river bank and railway areas are not shown on the map. The accuracy of the map is also limited by the location of the cell towers. The brightness of any point on the screen doesn’t reflect the level of cell phone activity on that point. The map is only accurate if you look at the overall trend, not specific points.
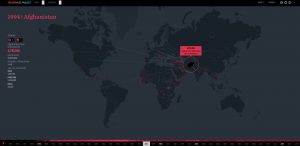
 http://www.therefugeeproject.org/
 Follow
