With the exception of some clustering in the core of the city, our output gentrification index layer appeared to display a largely random pattern across metropolitan Atlanta (Figure 3). As such, we produced a spatial autocorrelation report in order to assess the randomness of our derived index (Figure 5). The output Moran’s I value was very low (0.10), and the p-value was highly significant (p = 0), thus, we were able to infer that our gentrification index layer exhibited very slight clustering. In addition to this, we conducted a qualitative assessment between our gentrification index map and the Urban Displacement Project’s Gentrification and Displacement map for the City of Atlanta (Chapple & Thomas, 2020). We found that the tracts which ranked as “most likely” to be gentrified on our index layer correlated with “Advanced Gentrification” tracts in the Urban Displacement Project’s map. Similarly, we found that those which ranked as moderately at risk for gentrification in our index layer were related with “At Risk of Gentrification” or “Early/Ongoing Gentrification” tracts in the Urban Displacement Project’s map.
Due to the dual real-estate and social considerations, tracts with low index scores were largely split between the extremes of “Low-Income/Susceptible to Displacement” and “Stable/Advanced Exclusive”. This can be attributed to the nature of gentrification and the index scoring. Because gentrification is a simultaneous increase in real estate values and change in social characteristics, low but non-zero scores on the index can indicate either a lower-income neighbourhood where significant change has yet to occur beyond one or two areas, or a wealthy neighbourhood where real estate values are increasing but with little in the way of demographic change. Therefore, the index is best used to identify areas of high risk, where both factors must be present.
Figure 4 displays the Gentrification Index Map as described above, with the explanatory variable points overlaid to demonstrate overall patterns. No significant association with index scores is visible, but there is obvious clustering around the downtown area of Atlanta.
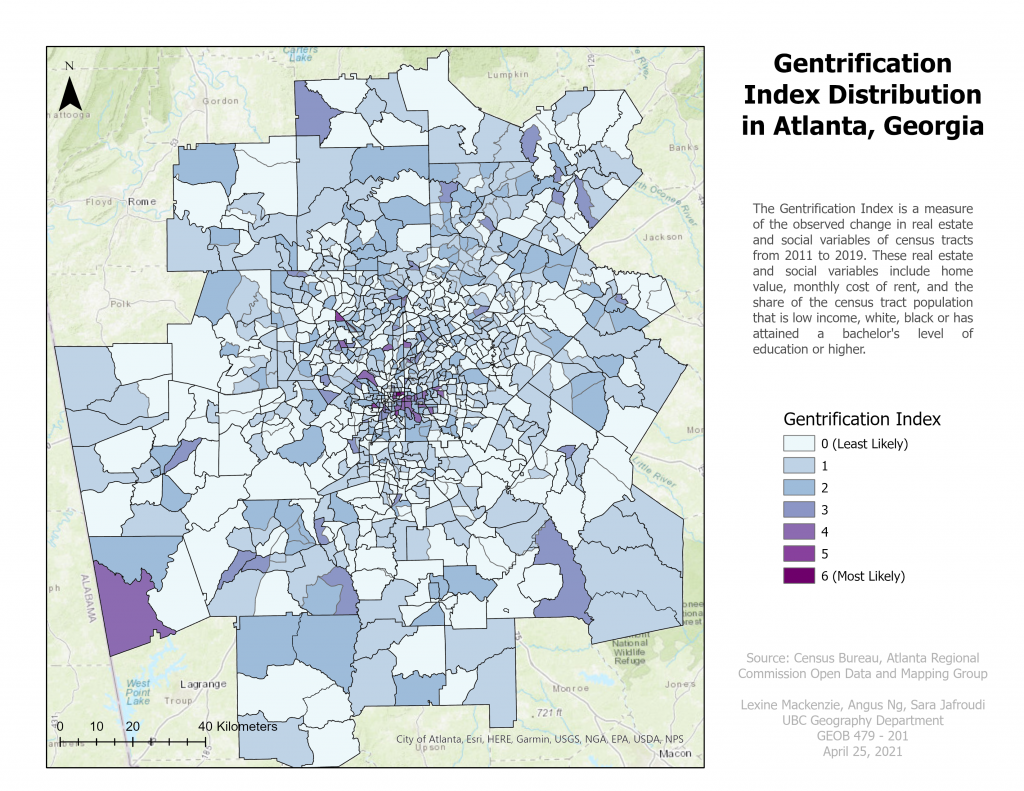
Figure 3: Gentrification Index Distribution in the Atlanta Georgia Region
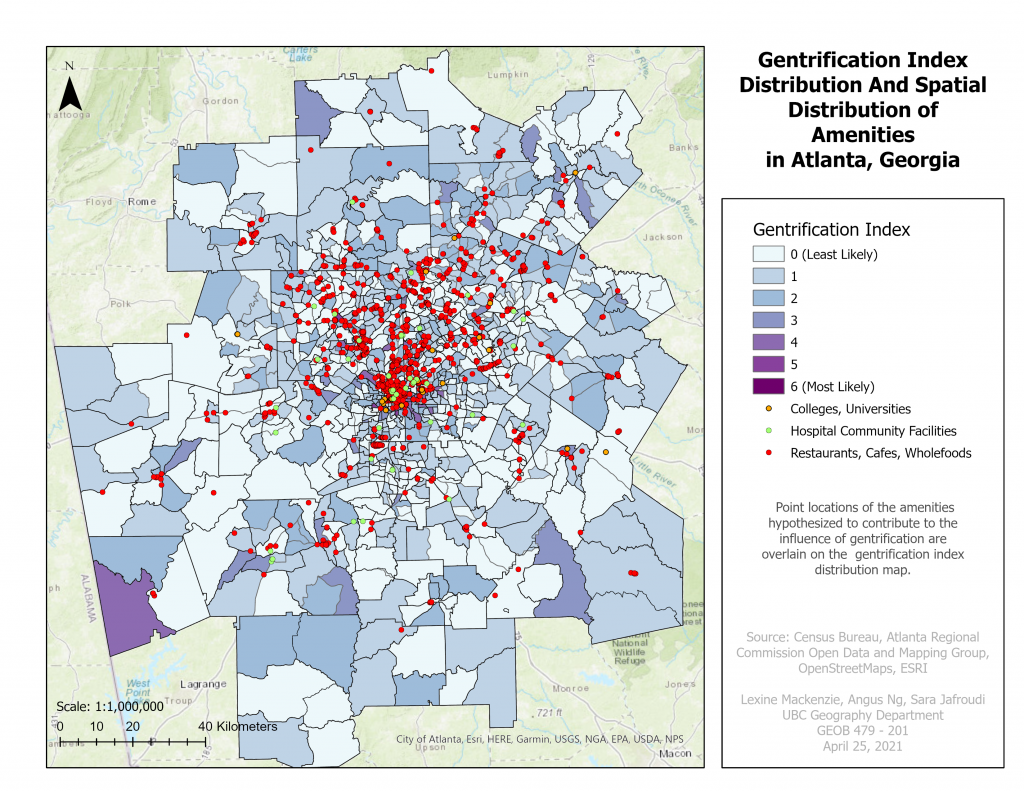
Figure 4: Gentrification Index and Spatial distribution of amenities in the Atlanta Georgia Region
Figure 5: Moran’s I Test for Autocorrelation for the Gentrification Index
Figures 6, 7, 8 and 9 portray our geographically weighted regression (GWR) results, modelling the relationship of each of the amenity variables and its association to our calculated gentrification index score. The figures show a Local R-squared value, representing the overall GWR model strength. Higher R-squared values indicated where the model performed better and lower R-squared values indicated where it had performed poorly. While the maxima of the local R-squared value is relatively low overall, we can still utilise the local R-squared as a measure of the GWR model’s power. In general, we can see that the GWR model performed well in the south and south-east of Atlanta’s core region and performed poorly in the northern and western outskirts, as well as the dense urban central region of metropolitan Atlanta. The overall R-squared for our GWR analysis was 0.14, signifying that our explanatory variables did not do a good job at explaining the spatial distribution of our dependent variable, the gentrification index. Thus, we can infer that the amenity spots selected do not sufficiently explain the gentrification risk status of a given locality across metropolitan Atlanta. This is contrary to what has been cited in literature on urban displacement, suggesting potential gaps in data.
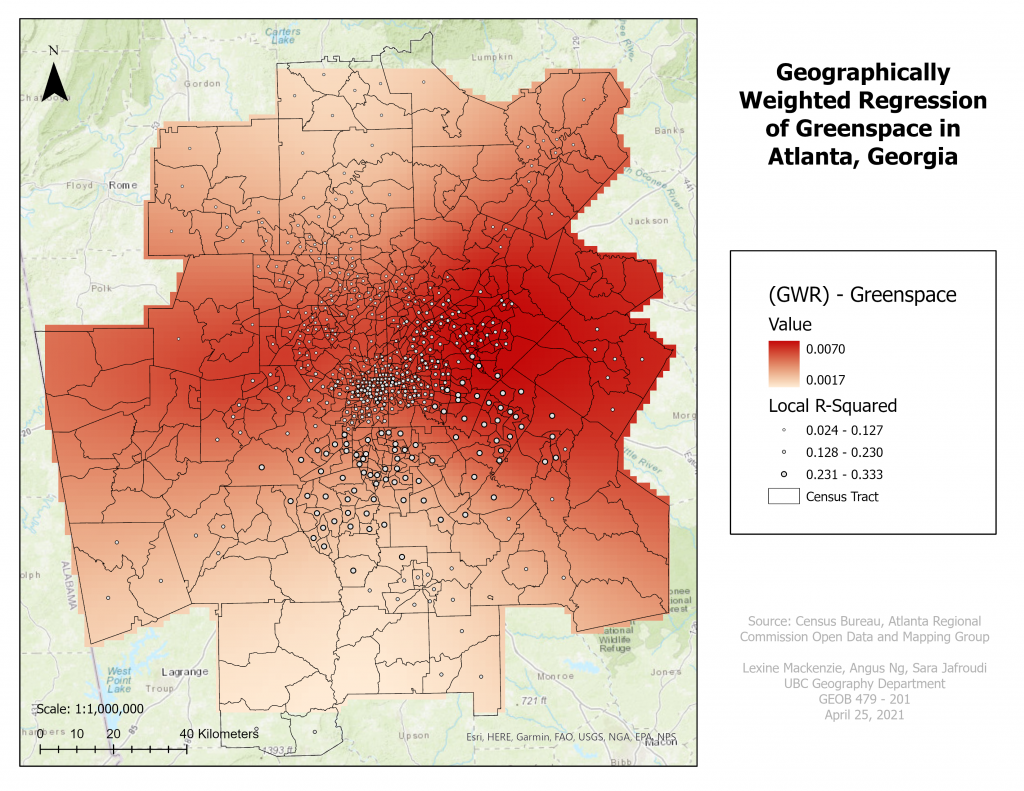
Figure 6: Geographically Weighted Regression of Greenspace in the Atlanta Georgia Region
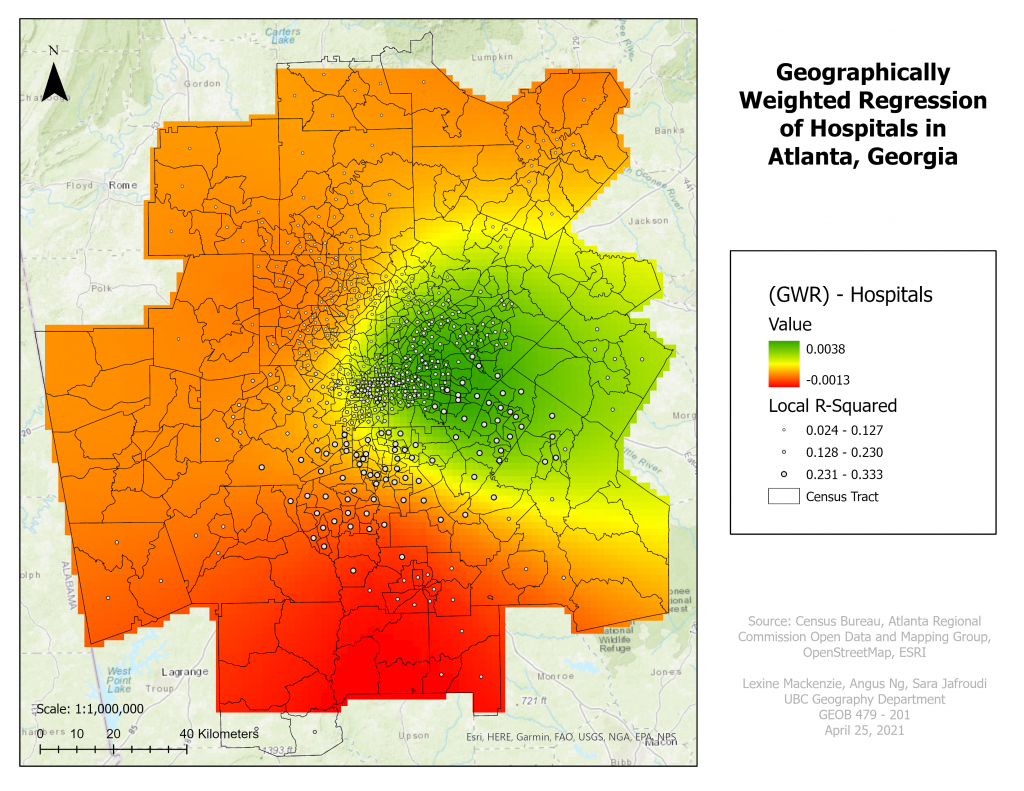
Figure 7: Geographically Weighted Regression of Hospitals in the Atlanta Georgia Region
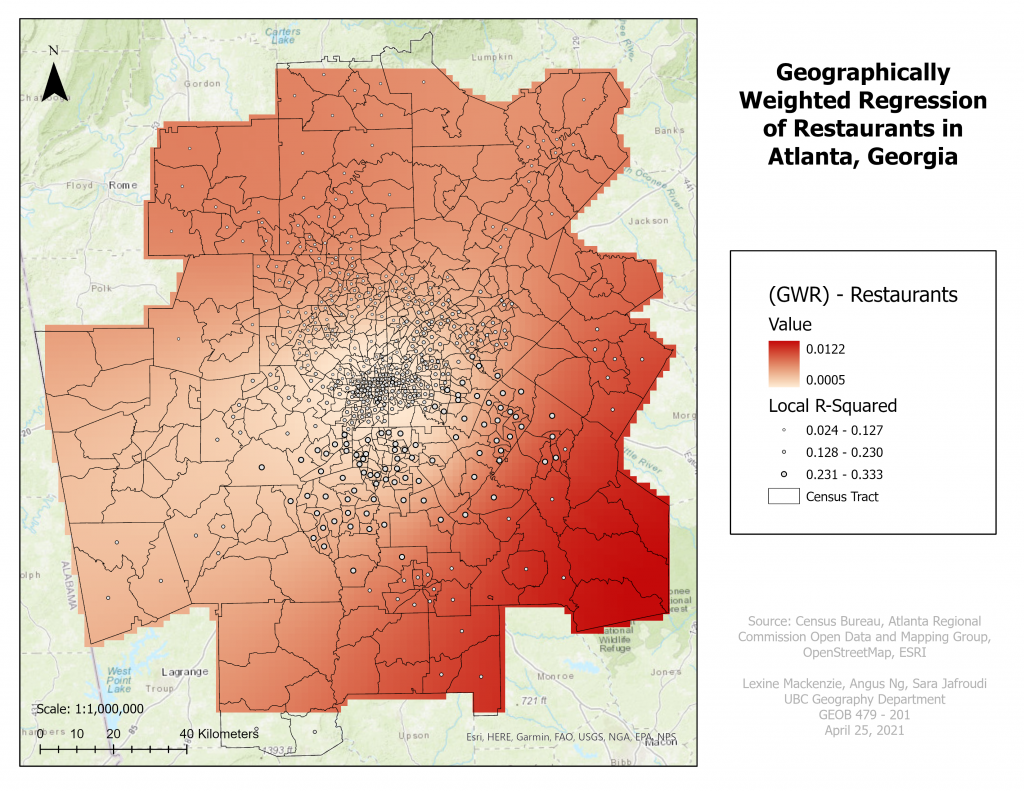
Figure 8: Geographically Weighted Regression of Restaurants in the Atlanta Georgia Region
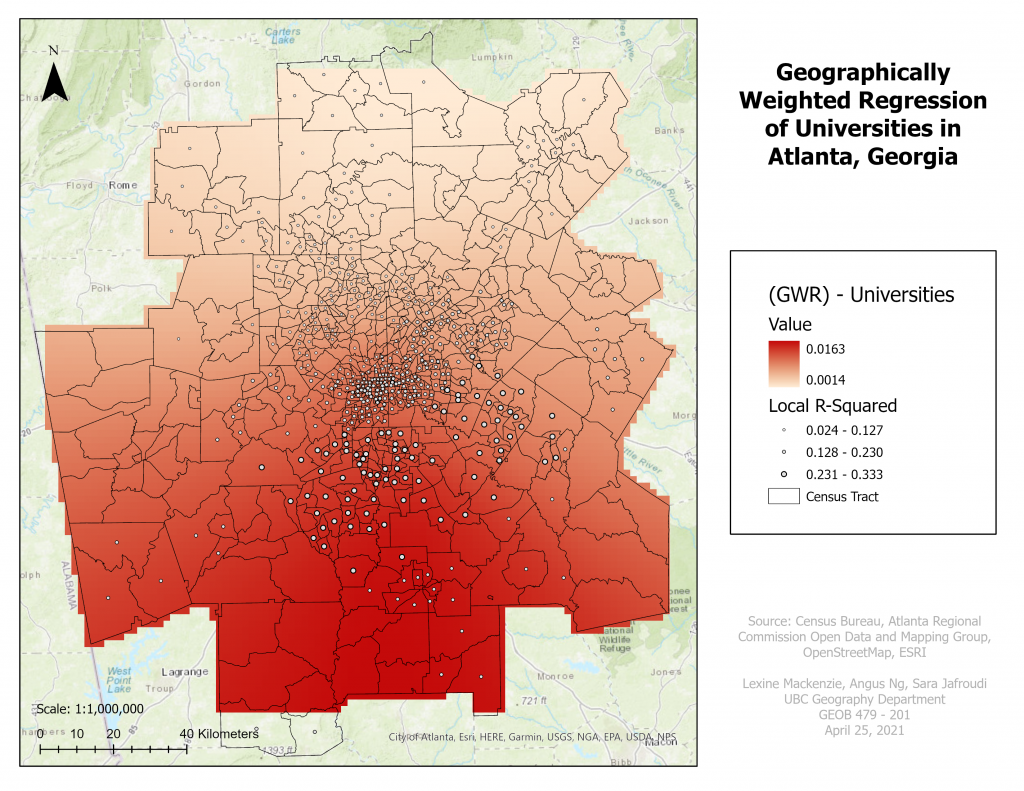
Figure 9: Geographically Weighted Regression of Universities in the Atlanta, Georgia Region