Monthly Archives: March 2014

Project Implementations and Outcomes

The following will address how we utilized RETScreen to analyze the energy data that we have received from our client. Furthermore, the project implementations and outcomes are illustrated as well.

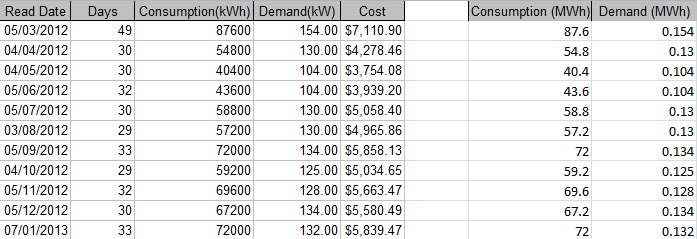
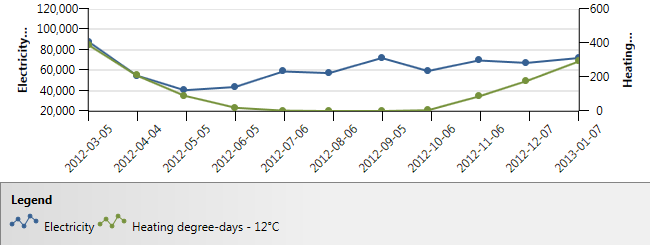
During our initial meeting with our client, we were introduced to RETscreen. RETscreen is the primary software we used in this project. It is a powerful software and is relatively easy to learn. We received the energy usage data in the form of an excel file. The file was organized for unit and format compatibility. Once ready, the file was imported into RETscreen for analysis. Energy, electricity and water consumption data were independently plotted against heating degree days (HDD) in an attempt to find a relation between the 3 scenarios. We also tried to optimize the heating degree days threshold to obtain the highest level of R^2. The last scenario was combining both electricity and gas consumption to get total consumption and plotted that data set against heating degree days. Units were kept consistent throughout the process. Electricity units were in kWh, power units were in kW, fuel consumption units were in GJ and water consumption units were in L. The following regression analyses were obtained:

Electricity Consumption vs. HDD

Electricity Consumption Graph.png

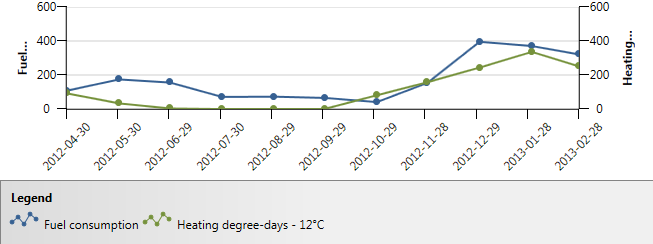
Fuel Consumption vs. HDD

Fuel Consumption Graph.png

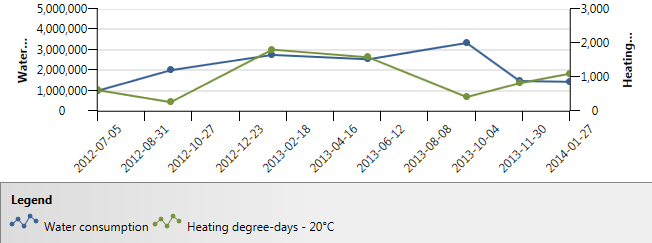
Water Consumption vs. HDD

Water Consumption Graph.png

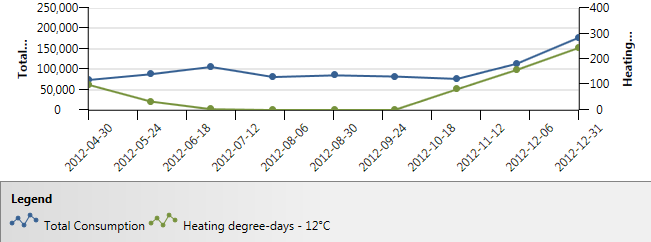
Total Consumption vs. HDD

Total Consumption Graph.png

The data analysis and evaluation of results were relatively straight forward compare to the application of the the result. Once we had determined the results of the data analysis, it was difficult to predict the exact outcome they will have on the building tenants when implemented. It was important for us to provide the client with results that are applicable, realistic, and easy to understand. Therefore, it was imperative that the results which we report have meaning to the client and the end users.

The project outcomes are providing the energy saving strategies in terms of cost, and reduce of energy consumption for one of BC Housing managed buildings. Provide the client with a comprehensive report on effective energy usage strategies, and building tenants with guidelines on improving the energy consumption.

Assigned Tasks

For the final project deliverable, we divided the workload into multiple tasks to effectively manage the magnitude of work, and complete prior to deadline ensuring the client receives an effective and comprehensive report.

List of Tasks:

1. Analysis of data using RETScreen Plus

  • Responsible: Daniel Tan and Mike Louws

  • Resources

    • Utility, weather and audit data

    • RetScreen – free software from  www.nrcan.gc.ca

  • No monetary costs

  • Tasks: Acquire Utility data from client, the weather data from NASA satellite, and input into RetScreen Plus.

  • Estimated time for completion: 3 days

  • Methods for completing task: Retscreen programing to achieve working energy model

  • Risk issues: Inaccurate data could make the final report obsolete

2. Comparison of results to existing data

  • Responsible: Eliot Huang and Katie Luo

  • Resources: Data analysis from previous task

  • No monetary costs

  • Tasks: Compare the results from Daniel and Mike to existing data to confirm or optimize energy data

  • Estimated time for completion: 3 days

3. Format project deliverable for client

  • Responsible: David Tran and Will Li

  • Resources: Analysis data and comparison results from previous tasks

  • No monetary costs

  • Tasks: Acquire information from Elliot and Katie for report writing

  • Estimated time for completion: 9 days

  • Google Document will be utilized for report writing

  • Risk issues: Incorrect reporting could provide a setback for client

Project Management Aspects of our CBEL Project:

As a group, we are to develop skills working in a team, however within that structured environment we also have to develop project management skills to ensure success working in a six person team. The following are skills that we have acquired project management wise:

  • Prioritize time for team meeting, group work and individual research

  • Coordinate with each other team members and client

  • Subdivide into multiple groups within group to maximize efficiency

  • Organize and distribute work load within team

  • On a personal level, develop effective communication skills between members and client

Examples of Excel data sets used for analysis:

Blog Post 4 - Energy Data.png
Electricity Consumption Data

Blog Post 4 - Gas Consumption Data.png
Gas Consumption Data

Milestones and Approaches

Currently, our project has progressed into the execution stage. The organizational aspect of this project, as well as the approach to our work, is outlined in this post.

Milestones

  • January 22.  Orientation Session. Introduction to project management, discussion of key project goals, and description of the purpose of Community Based Experiental Learning (CBEL) projects.

  • January 24: Initial meeting with client.

  • February 21: Neighbourhood Energy Utility tour. Second meeting with client to discuss vision, goals, and next steps.

  • March 5: Third client meeting. Received and discussed M&V data for the building of interest

  • March 24: Report analysis results to the client

  • March 5-27: Weekly Team meetings to discuss progress

  • March 31: Poster presentation summarizing project outcome


The following Gantt Chart illustrates a timeline of the processes and milestones involved in this project:

Brainstorming ideas

  • Comparison of available data (assessment data from consulting firms vs. data from RetScreen) to determine the areas where there can be energy cost savings

  • Compare energy (consumption) data with weather data to justify costs for a specific billing period or time of the year. After, a correlation can be found, provide recommendations for efficient use of energy to heat at a specific time with the intent of improving the utility bill.

  • Look for outlier cases(i.e. data points that don’t fit within what would be expected under normal conditions), and possibly suggest causes for these outliers.

Goals / Constraints / Strategies

The following addresses the goals, constraints and strategies we have compiled for our project.

Goals:

  • Gain a functional understanding of the M&V process and RETscreen

  • Perform Energy regression analysis (e.g. weather & energy usage) on RETscreen

  • Detail a cheat sheet or general guideline for building operations

  • Make energy saving recommendations

Constraints:

  • Gain a thorough understanding of M&V

  • Analyze energy data using softwares such as RETscreen

  • Detail a report on the M&V process and result

Strategies:

To help succeed with this project, our team created several strategies. As a group, we decided to meet at least once a week during school hours to keep up with work in a timely manner. During these meetings, we will discuss blog posts, data analysis and attempt to thoroughly learn the basics of RETScreen that will be used to analyze energy and weather data. We believe that splitting up the workload among all members is the best way to evenly distribute the work. This method allows everybody to have first hand experience with every stage of the project. In addition, we will familiarize ourselves with building design and data collection to the best of our abilities. When we encounter an issue, we will actively seek for help through online tutorials or request direct assistance from our mentor or client.

Site Visit

The following is an extra entry about our recent visit to the Neighbourhood Energy Utility, and is not intended to serve the purposes of any of the project specific posts.

Discretely placed under the Cambie street bridge, the Neighbourhood Energy Utility would be difficult to notice if you didn’t know what it was. Aside from 5 exhaust pipes peeking beside the Cambie bridge, its hard to tell that there is a large scale energy from sewage facility tucked so neatly below the bridge. But the purpose of the NEU facility is anything but hidden. In keeping with the City of Vancouver’s goal of making all new buildings in Vancouver carbon neutral by 2020, the NEU is an innovative and new approach to the renewable energy field. The first of it’s kind in North America, it was a privilege to have a personal tour with an engineer working at the facility. The tour was comprehensive and provided some background information on the facility and an explanation of purposes of key components. He us through the step by step process of how the plant collects energy and finished with how it distributed to the entire southeast side of False Creek.

Vision

The vision of the Neighbourhood Energy Utility is to reduce greenhouse gas emissions by relying less heavily on carbon energy, and instead focusing on thermal energy. This vision is played out in the concept of district energy. In the particular case, the district energy source is thermal energy that is taken from raw sewage and then transferred through the neighbourhood using a clean hot water loop. The goal of the project is to reduce greenhouse gas emissions by 50%.

 How it Works

The system begins with raw sewage entering the facility, where it is filtered to remove larger particles. The sewage is then passed through heat pumps, which use a refrigerant that turns gaseous at low temperatures in order to turn the low energy heat in the sewage into high energy heat. In a separate closed loop, water is heated from the energy of the sewage, and then pumped throughout the neighbourhood. Each building has its own closed loop heat transfer system which provides energy for the building. The water in the NEU system then returns to the facility to be reheated, and restart the process.

 Future

The NEU is only operating at half of its potential heating capacity, and currently has plans to expand its distribution network beyond Southeast False Creek to take advantage of new developments within the area. The city has plans to install another heat pump in the further future pending investments from new clients.

1920414_10203127667970771_449005350_n.jpg

Group photo in front of NEU exhaust pipes beside Cambie Bridge

Heat Exchanger in NEU