Currently, our project has progressed into the execution stage. The organizational aspect of this project, as well as the approach to our work, is outlined in this post.
Milestones
-
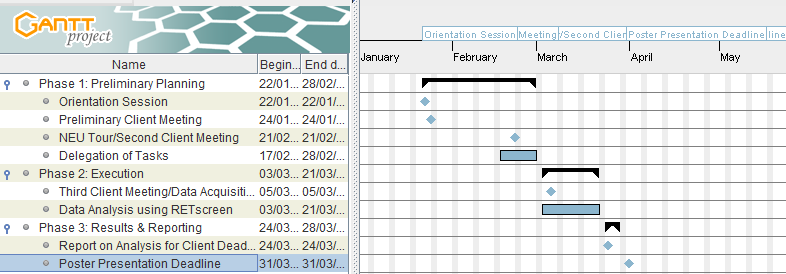
January 22. Orientation Session. Introduction to project management, discussion of key project goals, and description of the purpose of Community Based Experiental Learning (CBEL) projects.
-
January 24: Initial meeting with client.
-
February 21: Neighbourhood Energy Utility tour. Second meeting with client to discuss vision, goals, and next steps.
-
March 5: Third client meeting. Received and discussed M&V data for the building of interest
-
March 24: Report analysis results to the client
-
March 5-27: Weekly Team meetings to discuss progress
-
March 31: Poster presentation summarizing project outcome
The following Gantt Chart illustrates a timeline of the processes and milestones involved in this project:
Brainstorming ideas
-
Comparison of available data (assessment data from consulting firms vs. data from RetScreen) to determine the areas where there can be energy cost savings
-
Compare energy (consumption) data with weather data to justify costs for a specific billing period or time of the year. After, a correlation can be found, provide recommendations for efficient use of energy to heat at a specific time with the intent of improving the utility bill.
-
Look for outlier cases(i.e. data points that don’t fit within what would be expected under normal conditions), and possibly suggest causes for these outliers.