Here are a couple of math projects that I have created for students during my extended practicum.
Pre Calc 11: Rational Equations & Expressions Project
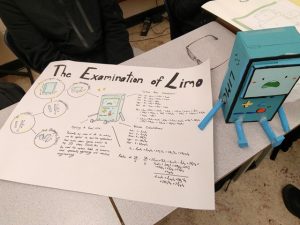
Each student will be creating a poster representing the learning objectives in Ch 6.1. You will also be presenting these posters during class. There will be four sections in your poster, which are listed below.
Section 1: Title of your 3D Shape
Please include the title of your 3D shape in the poster.
Section 2: Drawing of a 3D Shape
You must have a hand-drawn 3D shape where all the dimensions (width, length, radius, etc.) are labelled. The more creative your shape is, the better! Each dimension of the 3D shape must have at least a variable in it.
Section 3: Calculating the Surface Area & Volume
Using the dimensions, you must calculate the surface area and volume. Make sure to show all your work in the poster, so that readers themselves can understand how they are derived.
Section 4: Calculating the Ratio of Surface Area to Volume
Using the surface area and volume you have found in section 2, calculate the ratio of surface area to volume of the 3D shape. Make sure to show all your work in your poster.
Section 5: Applications to Ratio of Surface Area to Volume
Do some research to explain how your ratio of surface area to volume can be applied to real-life applications for your 3D shape. Can this be used for certain fields of science?
At the due date, you will be presenting your posters to the class. Each person will get 2-3 minutes of time to present.
Below is the rubric that will be used to assess your poster.
| Category | 4 | 3 | 2 | 1 |
| Required Elements | Exceeded the requirement needed on the poster. Made additional sections relating to the 3D shape. | Required sections on the poster are met. | Some of the required sections are not included on the poster. | Several required sections of the poster are missing. |
| Use of Time | Good use of time. Could tell student took time to ensure poster was professional and attractive. | Used time ok. Focused on getting the poster done and not especially concerned about attractiveness of poster. | Could tell time was not used well. Project either looks hurried and unfinished, or student claimed minimal time needed | Did not take time to do the project with thought and concern |
| Accuracy of Calculations | All calculations are accurately displayed, and there are no errors made in the calculations. | All calculations are accurately displayed, and only 1-2 errors are in made in the calculations. | Most calculations are accurately displayed, but others were not. There are some errors made in the calculations. | Calculations are not accurately displayed in the poster, and most of the calculations are wrong |
| Graphics – Originality | A graphic or drawing is made with the dimensions displayed, and the 3D shape reflects student creativity. | A graphic or drawing is made with the dimensions displayed, but are based on the designs or ideas of others. | A graphic or drawing is made, but the dimensions are missing. | No graphics or drawings were made by the student. |
Math 9: Statistics Project
In groups of two, you will be creating a poster representing the learning objectives in Ch 8.1, 8.2, 8.3 & 8.4.
Part 1: Creating a Survey to Investigate (On Paper)
Each group must create a survey consisting of 5 questions. Please create questions that are appropriate in the grade 9 level.
For the 5 questions:
- Three of the questions must have at least 3-5 answers to choose from.
- Two of the questions must ask for a number value.
Examples of topics for your questions: fruits, sports, music, etc.
You must also have to write a hypothesis for each question. What do you predict the answers to be and why? Please write your hypothesis on another sheet of paper.
Part 2: Selecting a Population, or Sample (on Paper)
After creating your survey, you must select whether your survey is for a population or for a sample.
If it is a population, please write down what population is of interest and why you chose it.
If it is a sample, then write down what type of sample it is, and why you chose it.
Part 3: Collecting Data (on Paper)
Once you have your population/sample of interest, you must take your survey and distribute it to them with the sampling method of your choice. Please refer to Ch 8.1 for the different type of sampling methods. You must have a minimum of 15 surveys completed by the participants, and it must be handed in along with part 1 and part 2.
Part 4: Analyzing and Displaying your Data (on Poster)
Once you have gathered all the data, you must show all your information on your poster.
On your poster you must include the 5 questions you have made, and include the following:
- For your 3 questions from part a, you must create three different types of graphs to show the answers you have gathered. Write what you can conclude from each graph. Make sure that the graph is not misleading. Please refer to Ch 8.4 for misleading graphs.
- For your 2 questions from part a, you must calculate the mean, median, and mode of all the answers, and display those calculations on the poster. Write what you can conclude from finding the mean, median, and mode.
Part 5: Assessing your Work (on Paper)
Once your poster is created, you will assess all the work you have done by answering the following questions.
- What type of influences could have affected your sampling method? (Refer to Ch 8.1) Explain how each influence was affected.
- Do you think the mean, median, and mode is accurate to your population/sample of interest? In what ways can you make it more accurate?
Part 6: Presentation
Each group will have to present their poster to the class at the due date. In your presentation, you must:
- State what questions you asked.
- State your hypothesis for each question.
- Show in your poster what results you actually got for each question.
- What influences were affected from your survey.
Below is the rubric that will be used to assess your poster & presentation.
| Category | 4 | 3 | 2 | 1 |
| Required Elements
|
All parts of the project were completed. | At least 4 parts of the project was completed. | At least 3 parts of the project was completed. | Several required parts of the project are missing. |
| Use of Time
|
Good use of time. Could tell student took time to ensure poster was professional and attractive. | Used time ok. Focused on getting the poster done and not especially concerned about the attractiveness of the poster. | Could tell time was not used well. Project either looks hurried and unfinished, or student claimed minimal time needed. | Did not take time to do the project with thought and concern. |
| Accuracy | All calculations are accurately calculated, and there are no misleading graphs. | All calculations are accurately calculated, but 1-2 graphs were misleading. | Most calculations are accurately calculated, but others were not. Some of the graphs were misleading. | Calculations are not accurately calculated in the poster, and most of the graphs were misleading. |
| Presentation
|
Clearly stated every question and hypothesis. All results are shown and influences are clearly stated and explained. | Everything was clearly stated and shown except for the influences. | Questions and results were stated, but the hypothesis and influences of the sampling methods were vague, unclear, or left out. | Did not state their hypothesis or influences. No results were shown. |