
Preserving Vancouver’s Heritage Sites
Final Project Report (PDF format): Preserving Vancouver’s Heritage Sites
Final Project Maps:
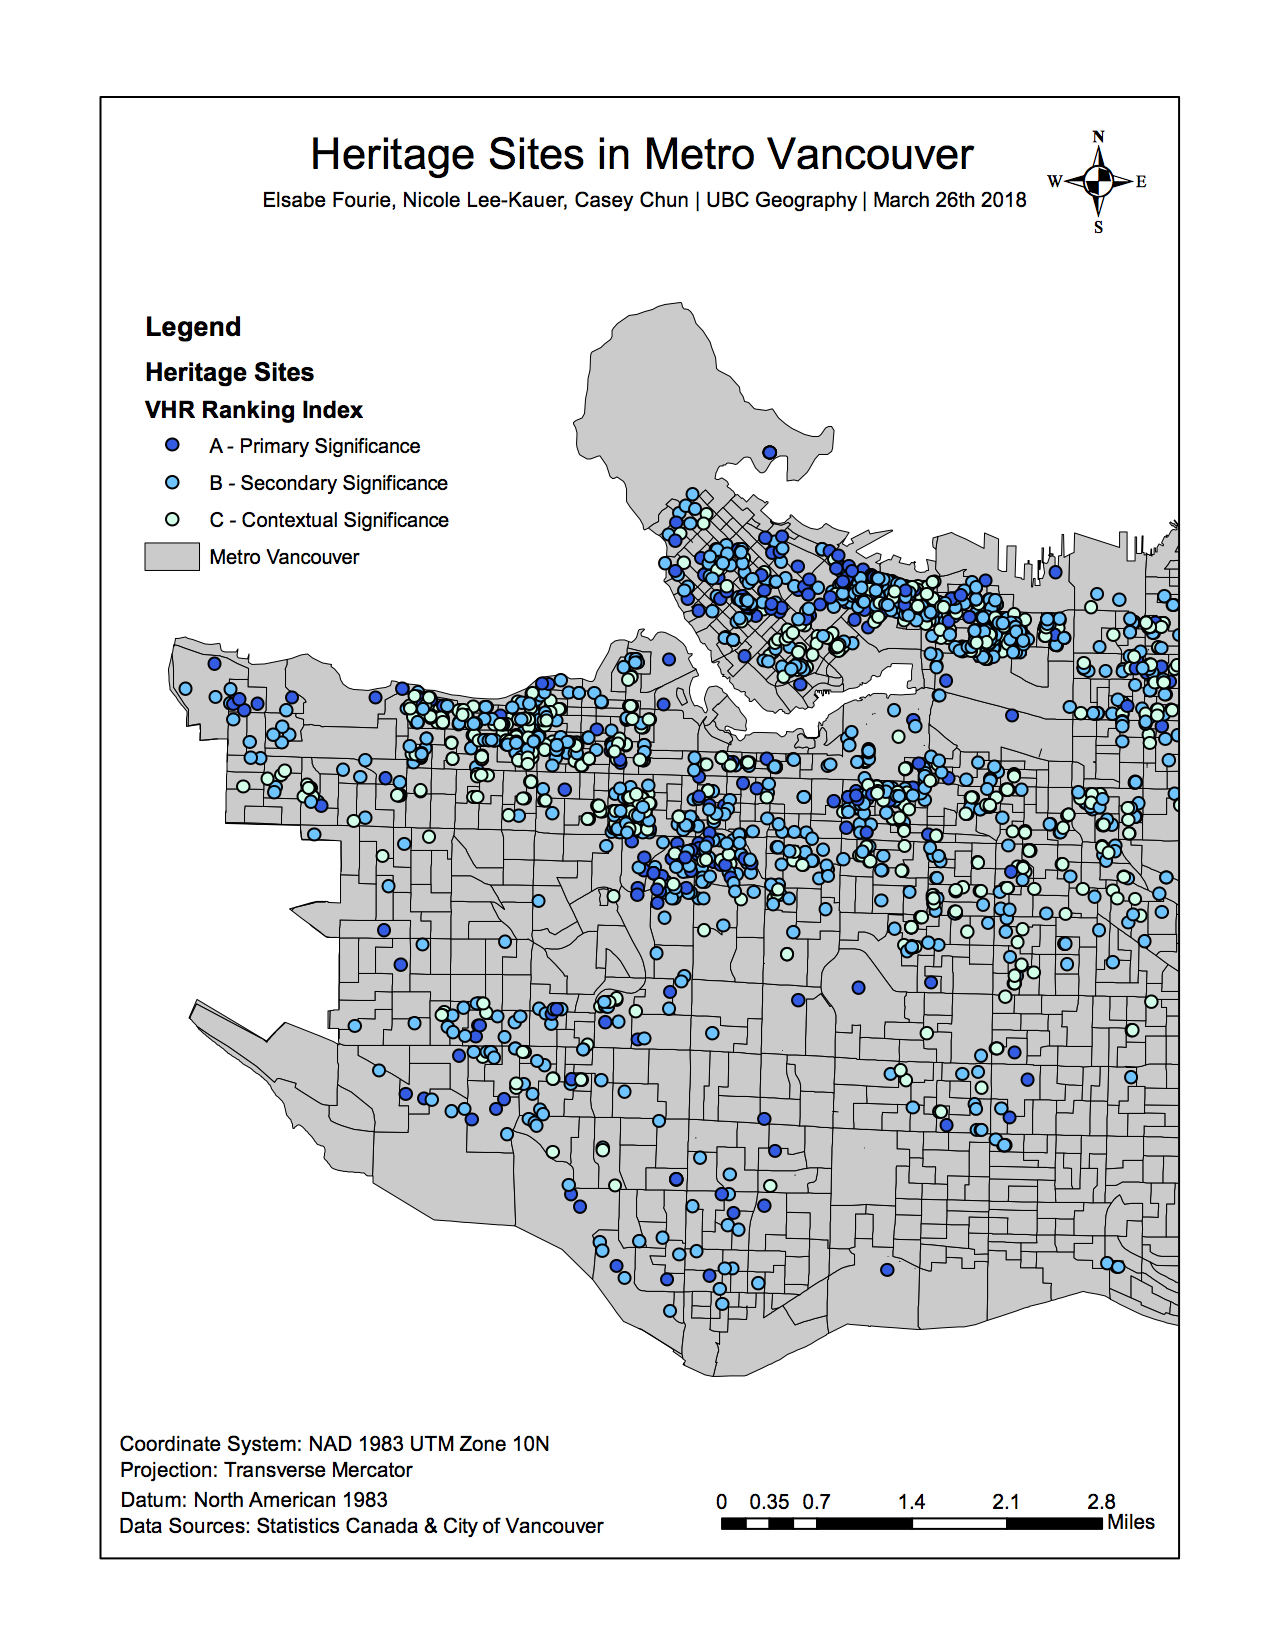
Map 1: Map 1 – Heritage Sites in Metro Vancouver
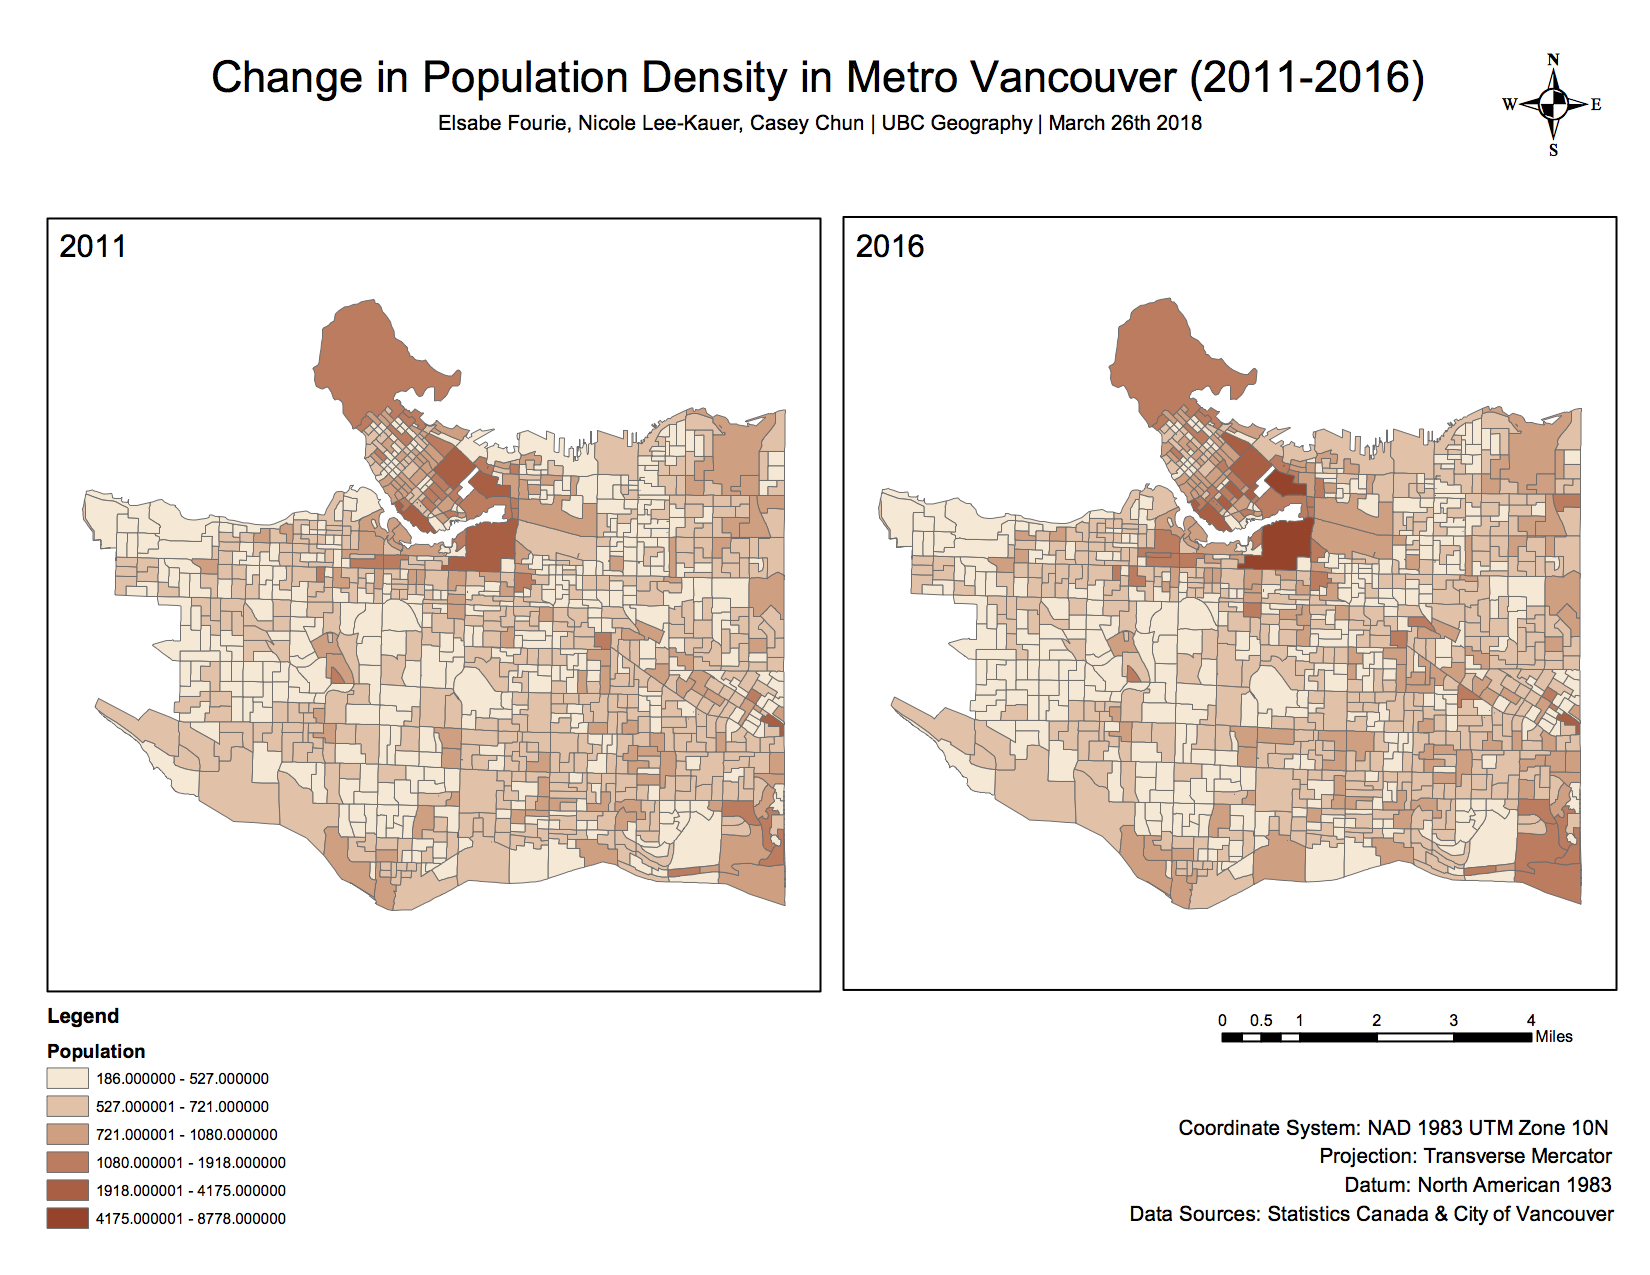
Map 2 (a): Change in Population Density in Metro Vancouver (2011-2016)
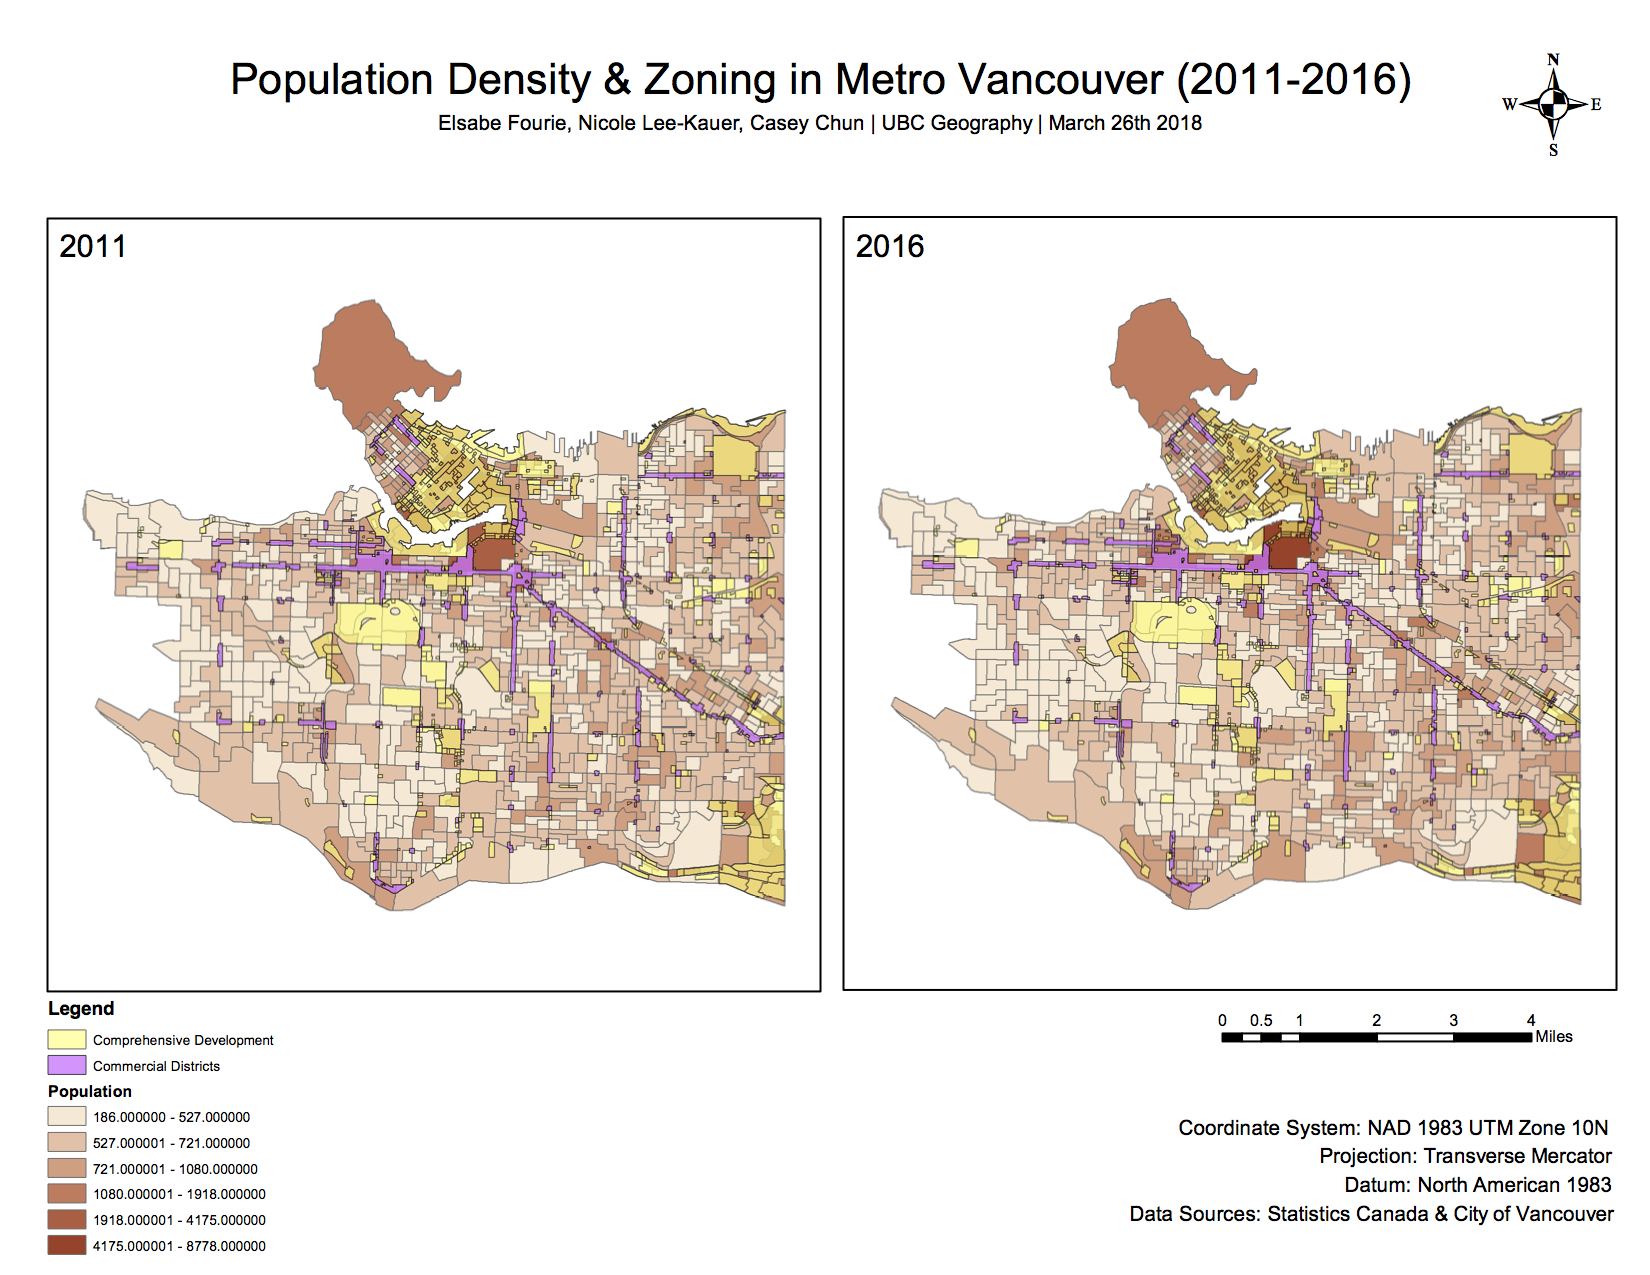
Map 2(b): Population Change and Zoning in Metro Vancouver (2011-2016)
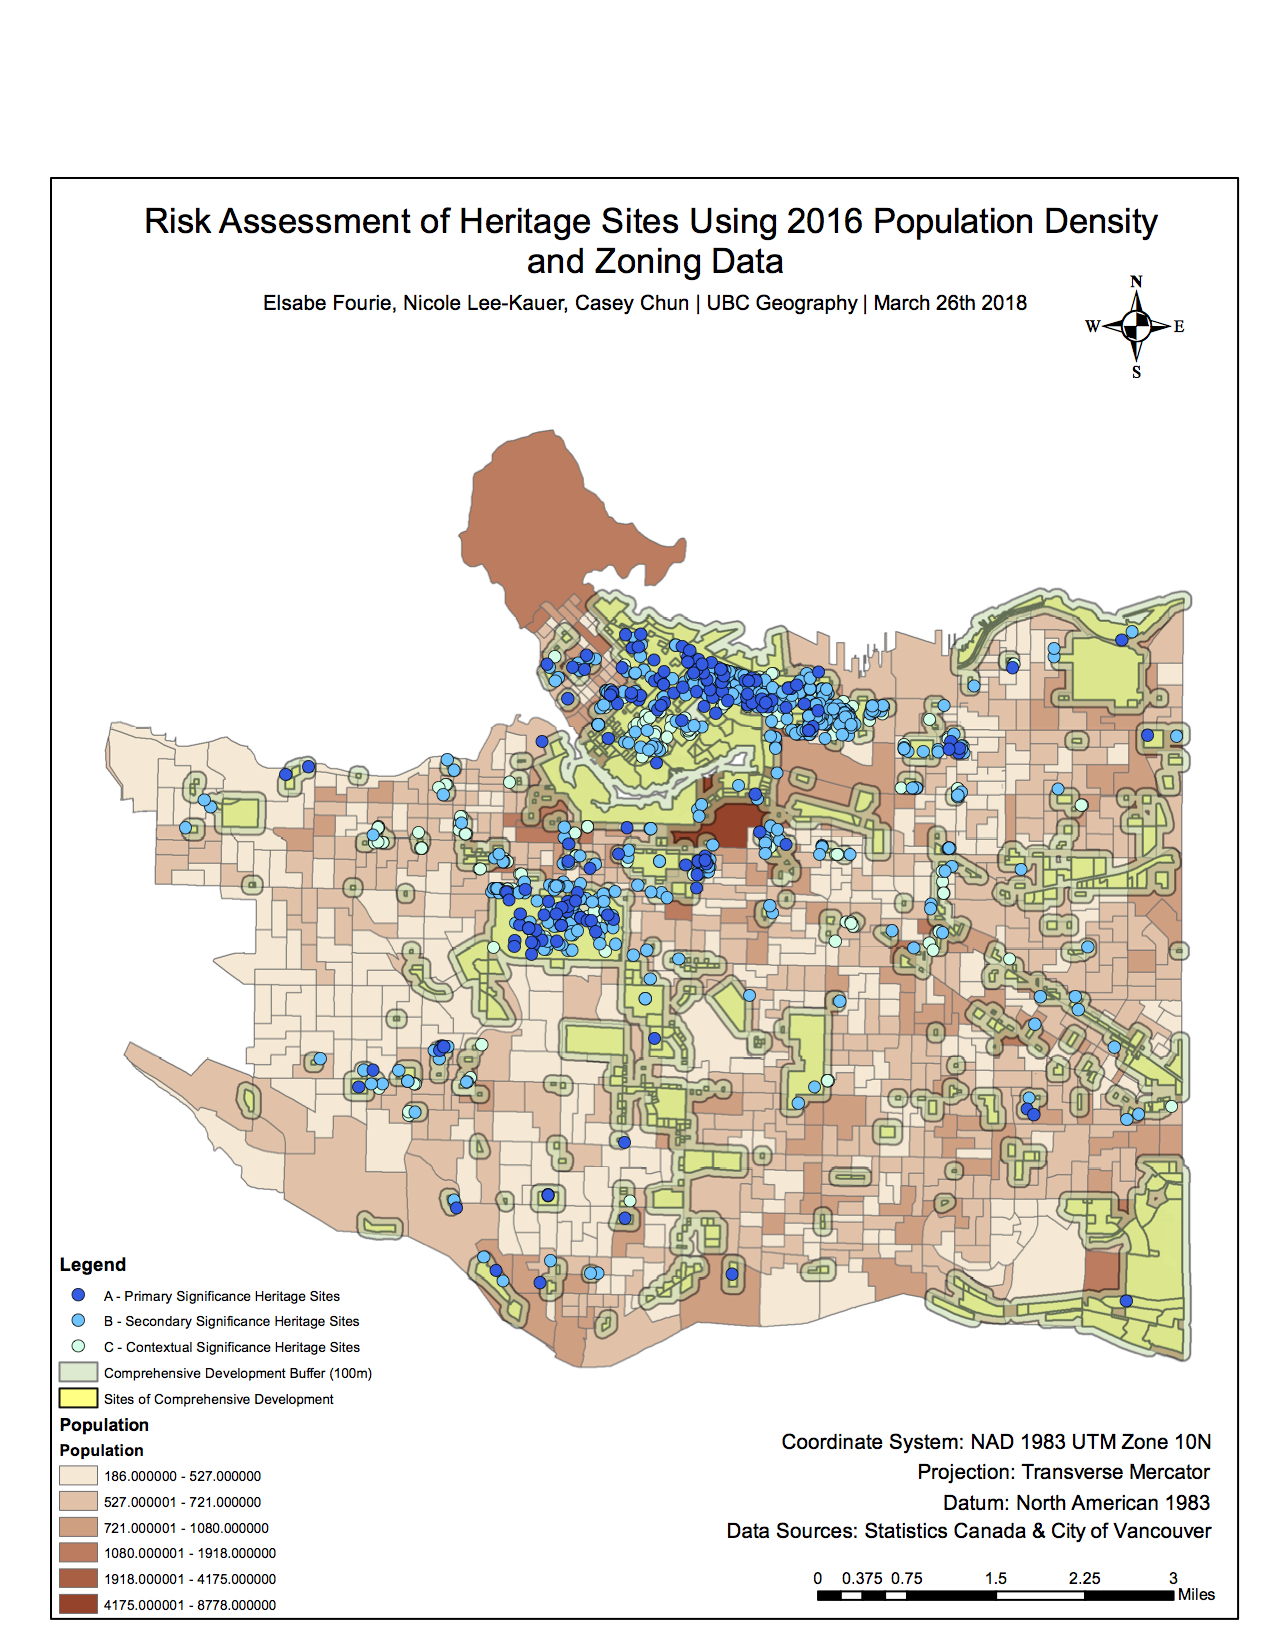
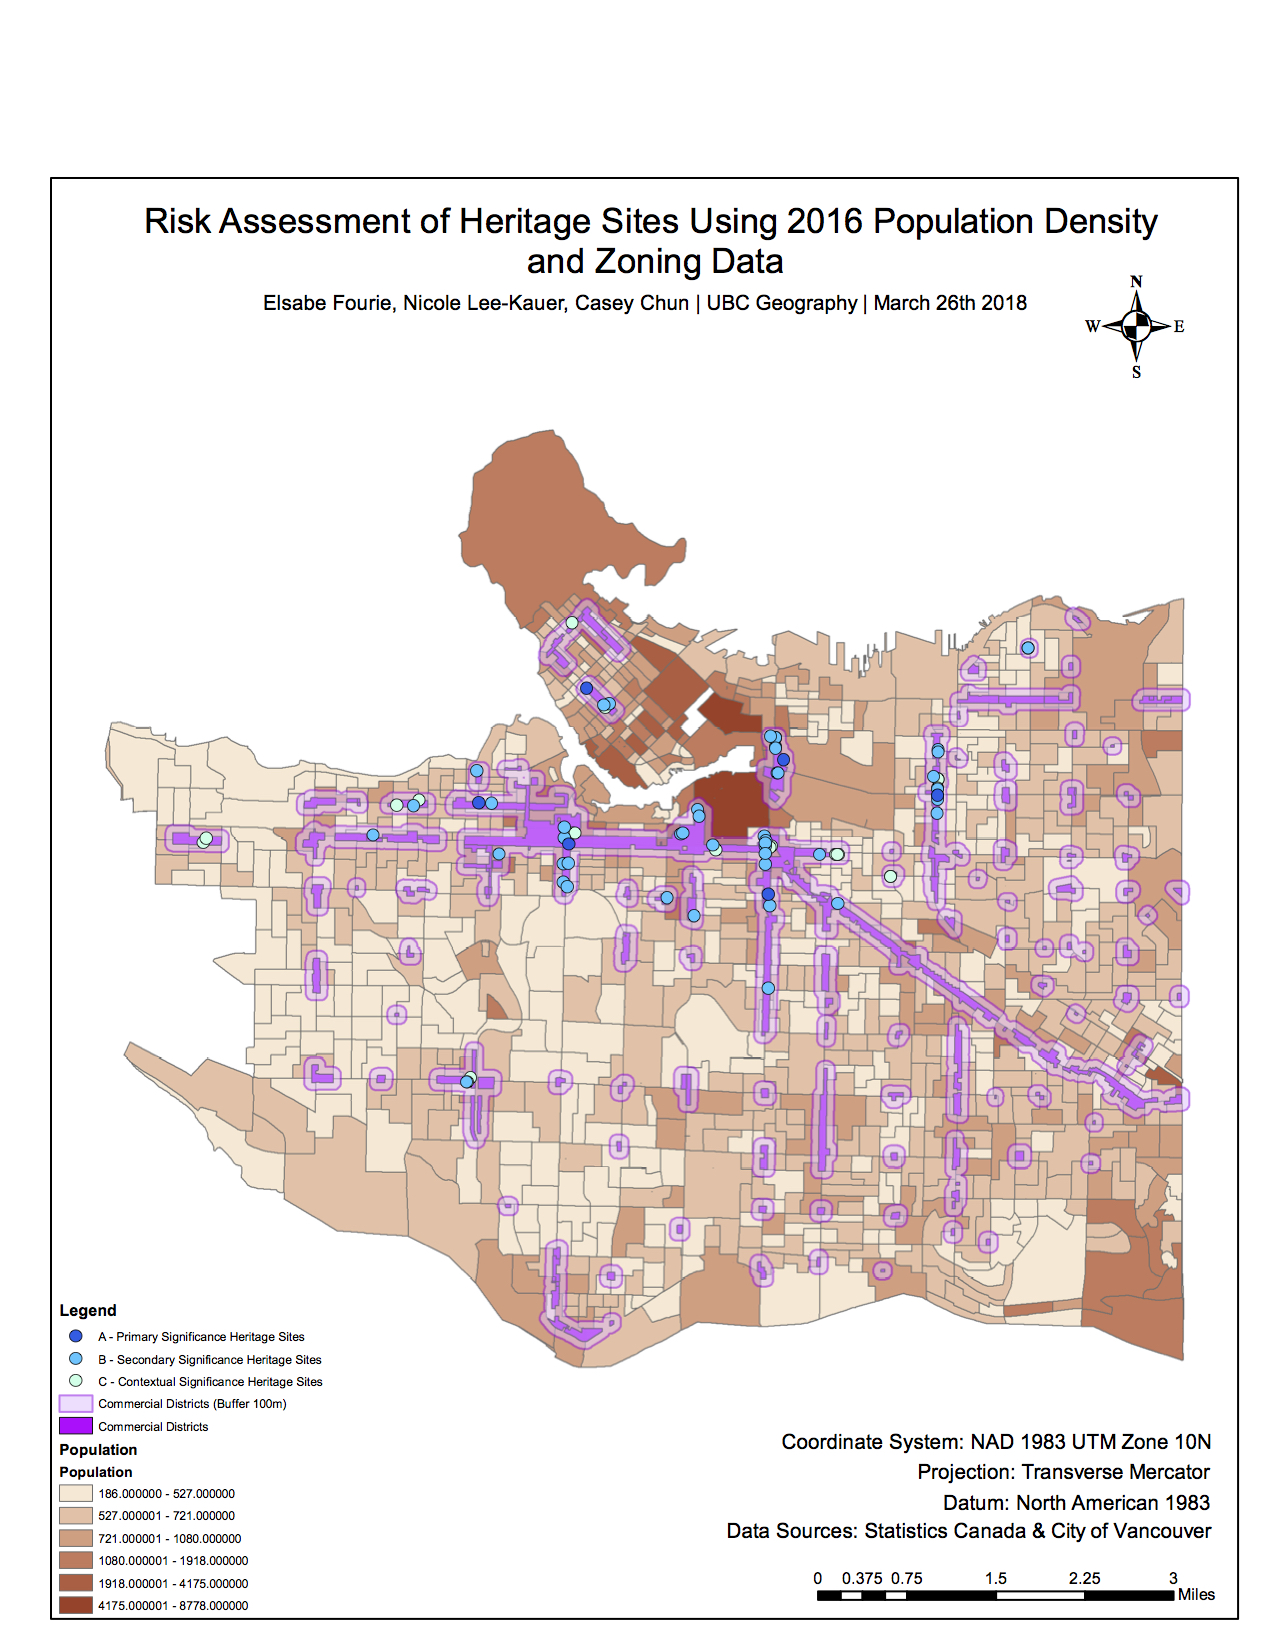
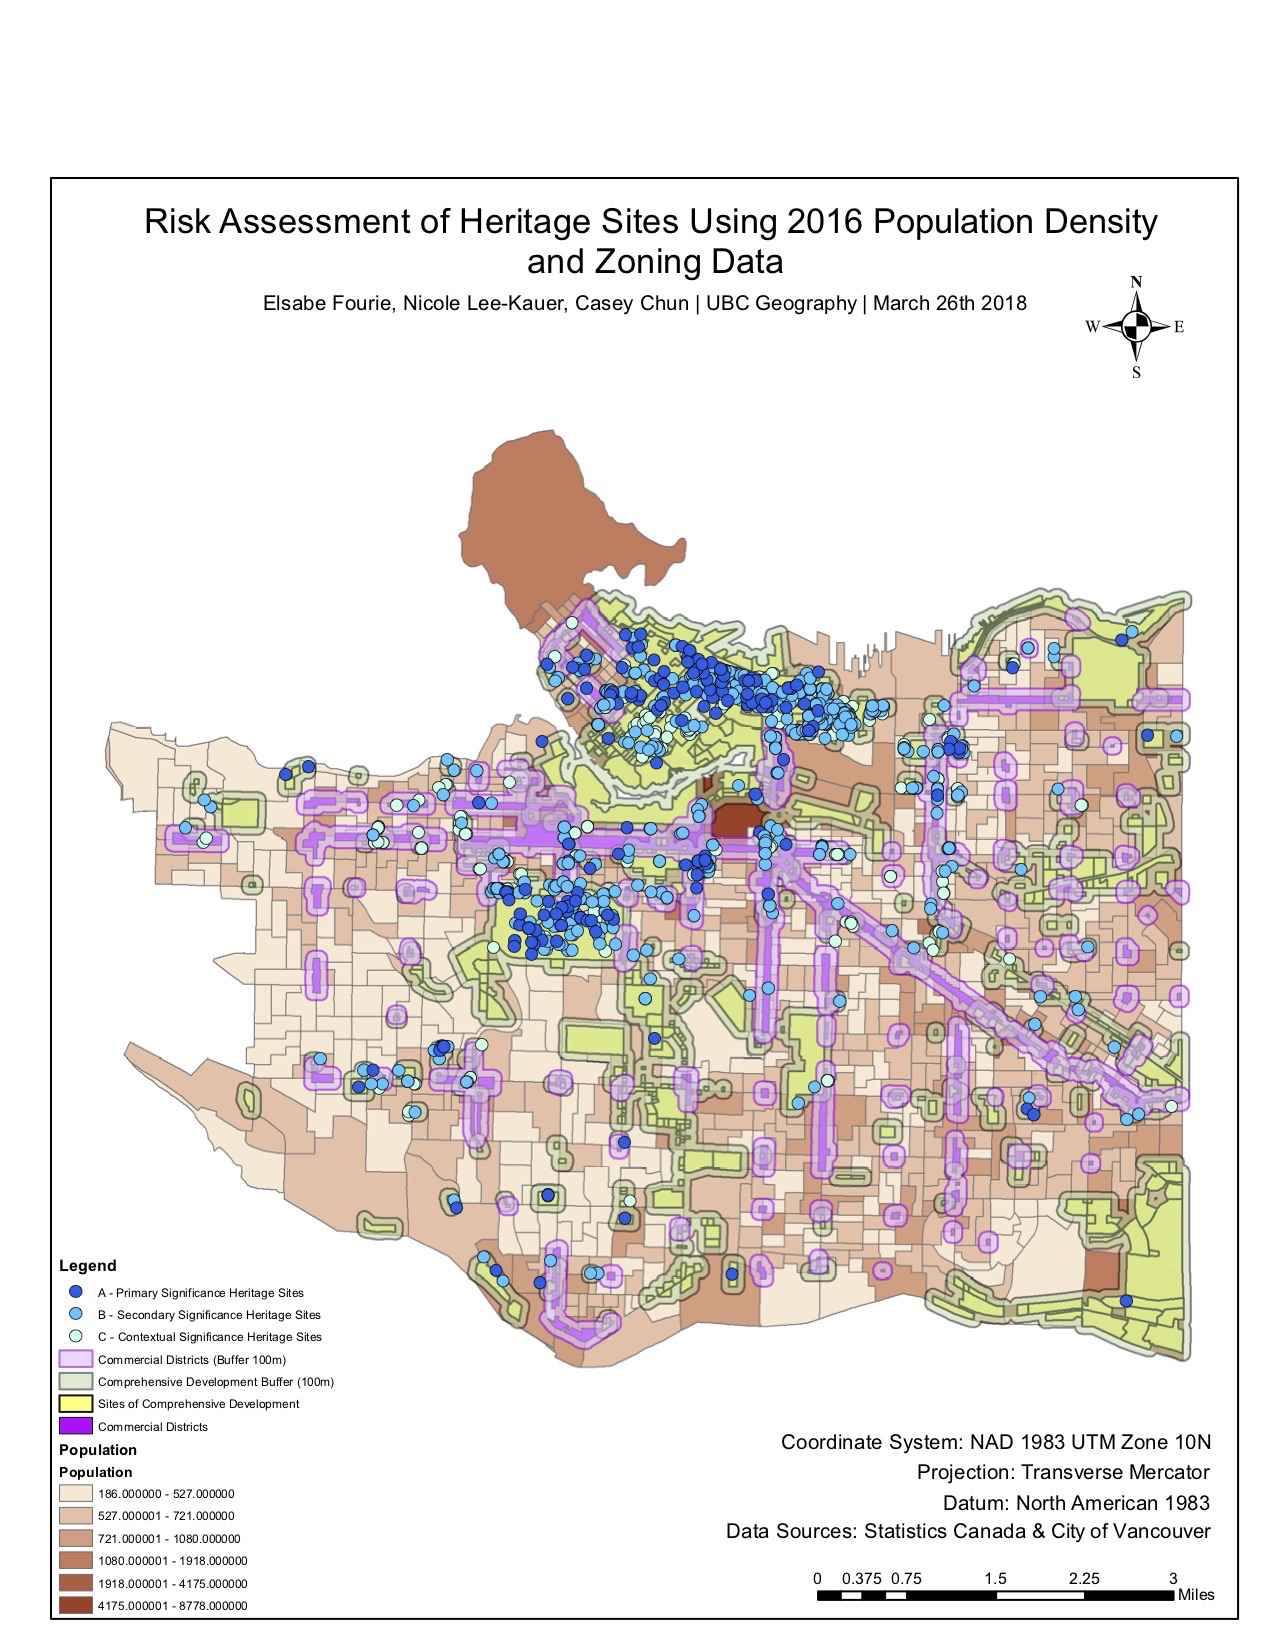
Map 3(c): Risk Assessment of Heritage Sites using 2016 Population Density and Zoning Data (Comprehensive Development + Commercial Districts)
To view the maps in full resolution, please click the name of the maps/the image itself.
Individual Submission Report:
Summarise the project: your team’s project proposal and goal?
- Throughout the course of this project, my team and I attempted to map out the existing Vancouver sites preserved under the heritage scheme, and depict the potential risks posed by zoning districts (specifically commercial districts and comprehensive development) and population change on those particular sites. To do so, we utilised heritage data (and it’s VHR rankings), zoning data, population density census and the Greater Vancouver shapefile (obtained from G:Drive). Our main goal was to map out the sites that were most at risk from urban development – specifically from the expansion of comprehensive development + commercial districts (as we deduced these zones would be more prone to expansion) and population increase. We aimed to produce a three-map series, with the first map illustrating existing heritage sites, the second depicting the population change in population density from 2011-2016, and the final maps showing which sites intersected with our buffer of potential developments respectively.
How did you organise your team (project management)?
Whilst executing the project, our team worked cohesively to create the maps together by working on a computer’s ArcGIS and in-person at the same time. The report was then divided equally amongst each other, with my role concerning the methodology, flowcharts, and a number of the appendices.
What are some interesting things you learned as a result of the process? For example:
- Some facts about the project?
- Some interesting GIS analysis techniques?
- Some facts about teamwork / project management approaches and techniques?
- Some issues or tips around data management on a team?
- Some issues around publicly available data and proprietary data?
During the project, I discovered that there was an existing VHR ranking index to class the various heritage sites in Metro Vancouver (i.e. A signified Primary Significance, B was Secondary Significance, whilst C represented Contextual Significance). Though we did not utilise all the ranking classes within our analysis, it was interesting to discover that there was a pre-existing scheme in place. As this was also the first time we made use of manual breaks as our main classification method, it was a new analysis technique we had to incorporate by calculating our own breaks (as per the distinct data points in population). I believe our teamwork approach was quite effective, as we were able to work collaboratively as a group, whilst collating a report online according to our internal deadlines we set beforehand. Though our final project was only finalised a few weeks beforehand, I believe we have compiled a high quality report. As for data management, we made use of one single account for ArcGIS, as we wanted to ensure that our database and files were at a single place and not disorganised. We also made use of Google Drives to upload back up files of our geodatabase, mxd files and finalised maps. Hence, we would all have equal access and distribution to the components of our project. One issue to this data sharing method is that team members upload documents without a naming convention, thus, it was difficult to determine which files represented which parts. In terms of issues surrounding public, open-sourced data, it was incredibly difficult to find a population density shapefile (for both 2011-2016) through Statistics Canada website. Much of the census data was only available as an spreadsheet or XLS – which was not suitable for our mapping requirements. As a result, we made use of the CHASS (Canadian Census Analyser) database to acquire the datum. Though after downloading, we still had issues with the attribute table not showing any values for Population 2011 (as the values came up as 0 for the entire column), we resolved this by downloading Population 2011 and 2016 separately, instead of checking them together.