Our task for this project was to place 1500 garbage cans around the City of Vancouver. To meet this goal, we created new flow charts based on the old chart previously given to us by one of our clients. There are four flow charts that apply to seven zones respectively: beaches, parks, schools, residential, commercial and downtown.
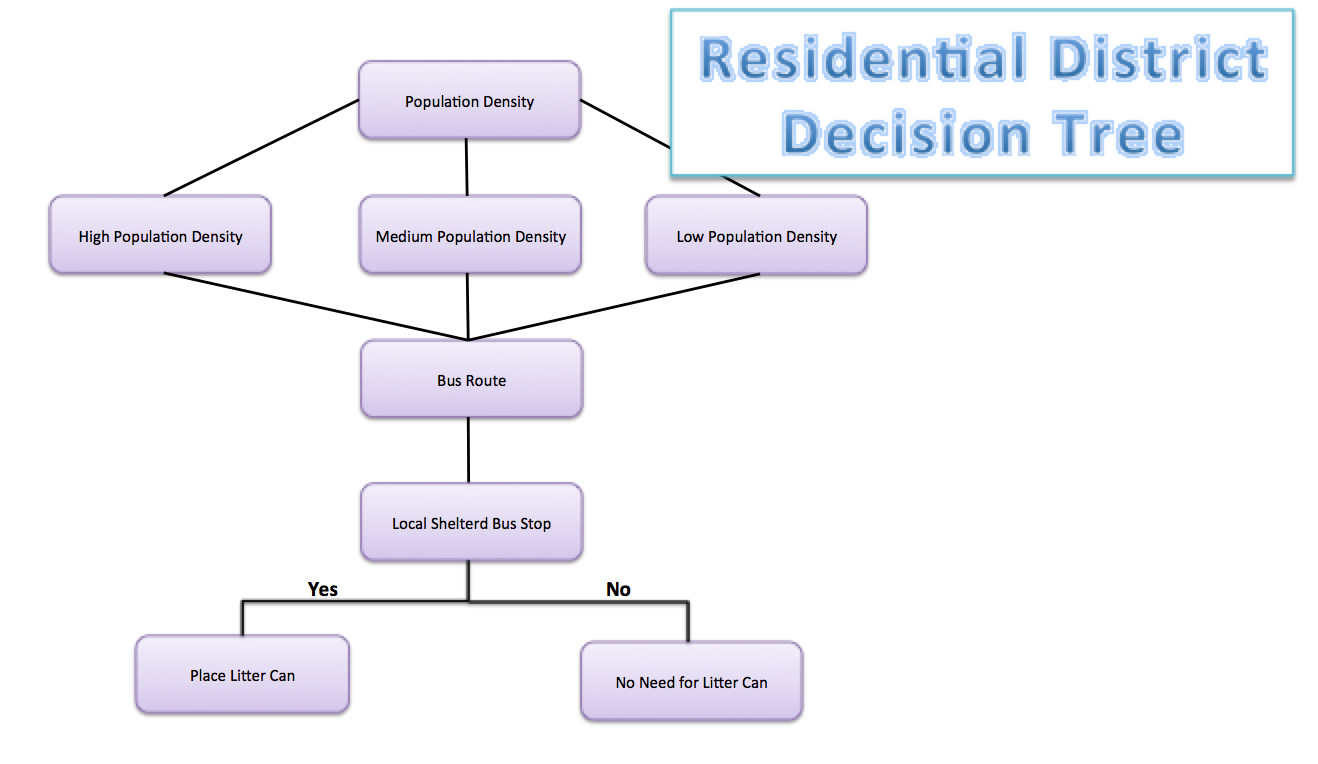
Tijana and Tyler were responsible for the creation of the residential flow chart. To provide rationales for their choices, they looked at Google earth and pedestrian flow charts. Here is what they found:
1.) There are generally no garbage cans placed on the street
2.) If there are litter cans in residential areas, they are typically found at sheltered bus stops
So what Tijana and Tyler decided on was to base a model around sheltered bus stops. This seemed to be in areas of highest pedestrian traffic, and made for the most efficient allocation of litter cans.
Here is the decision tree they made for Residential Areas.
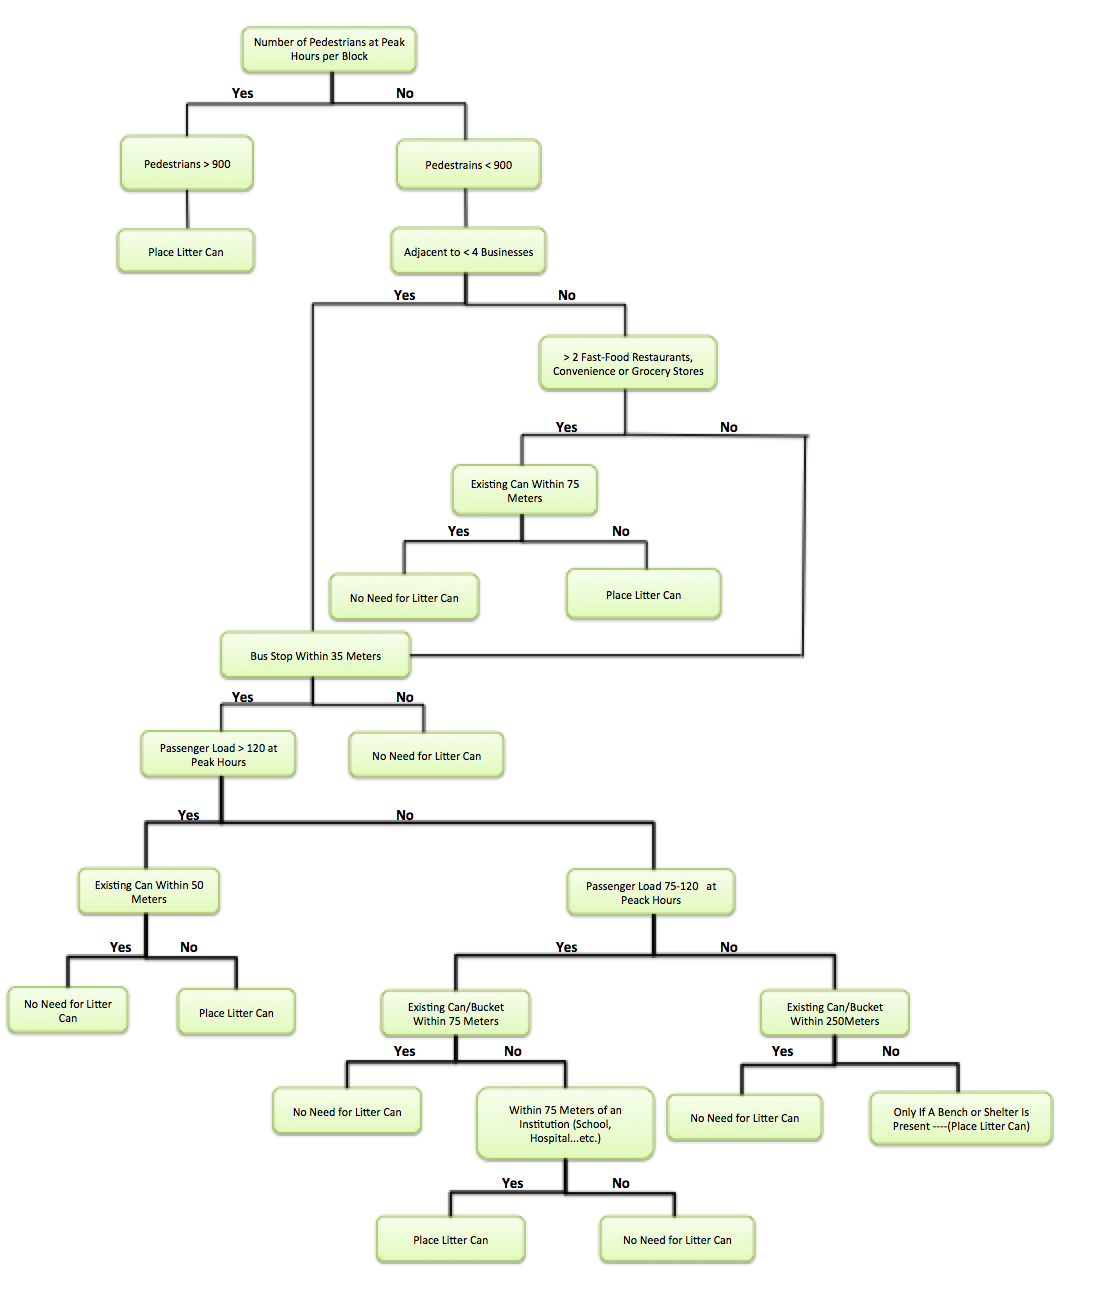
Richard and York were responsible for the creation of the commercial flow chart. Their methods were very similar to Tijana and Tyler’s, but they focused more on the numbers of pedestrian flow and the amount of “street food” vendors on the street. Street food is a term Richard and York coined to define coffee shops, food stalls and fast food joints. They also focused on the main factors which affect the pedestrian traffic numbers in commercial areas, including bus stops and the number of nearby businesses. In creating the flow chart, a lot of inspiration was drawn from the original flow chart given to the group by the client.
Here is a look at their current work.
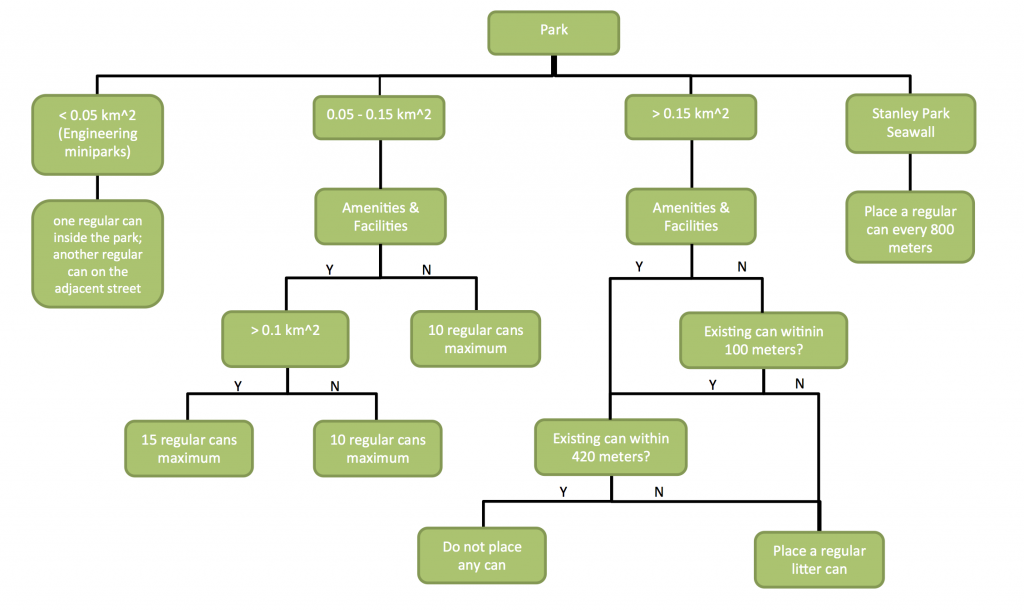
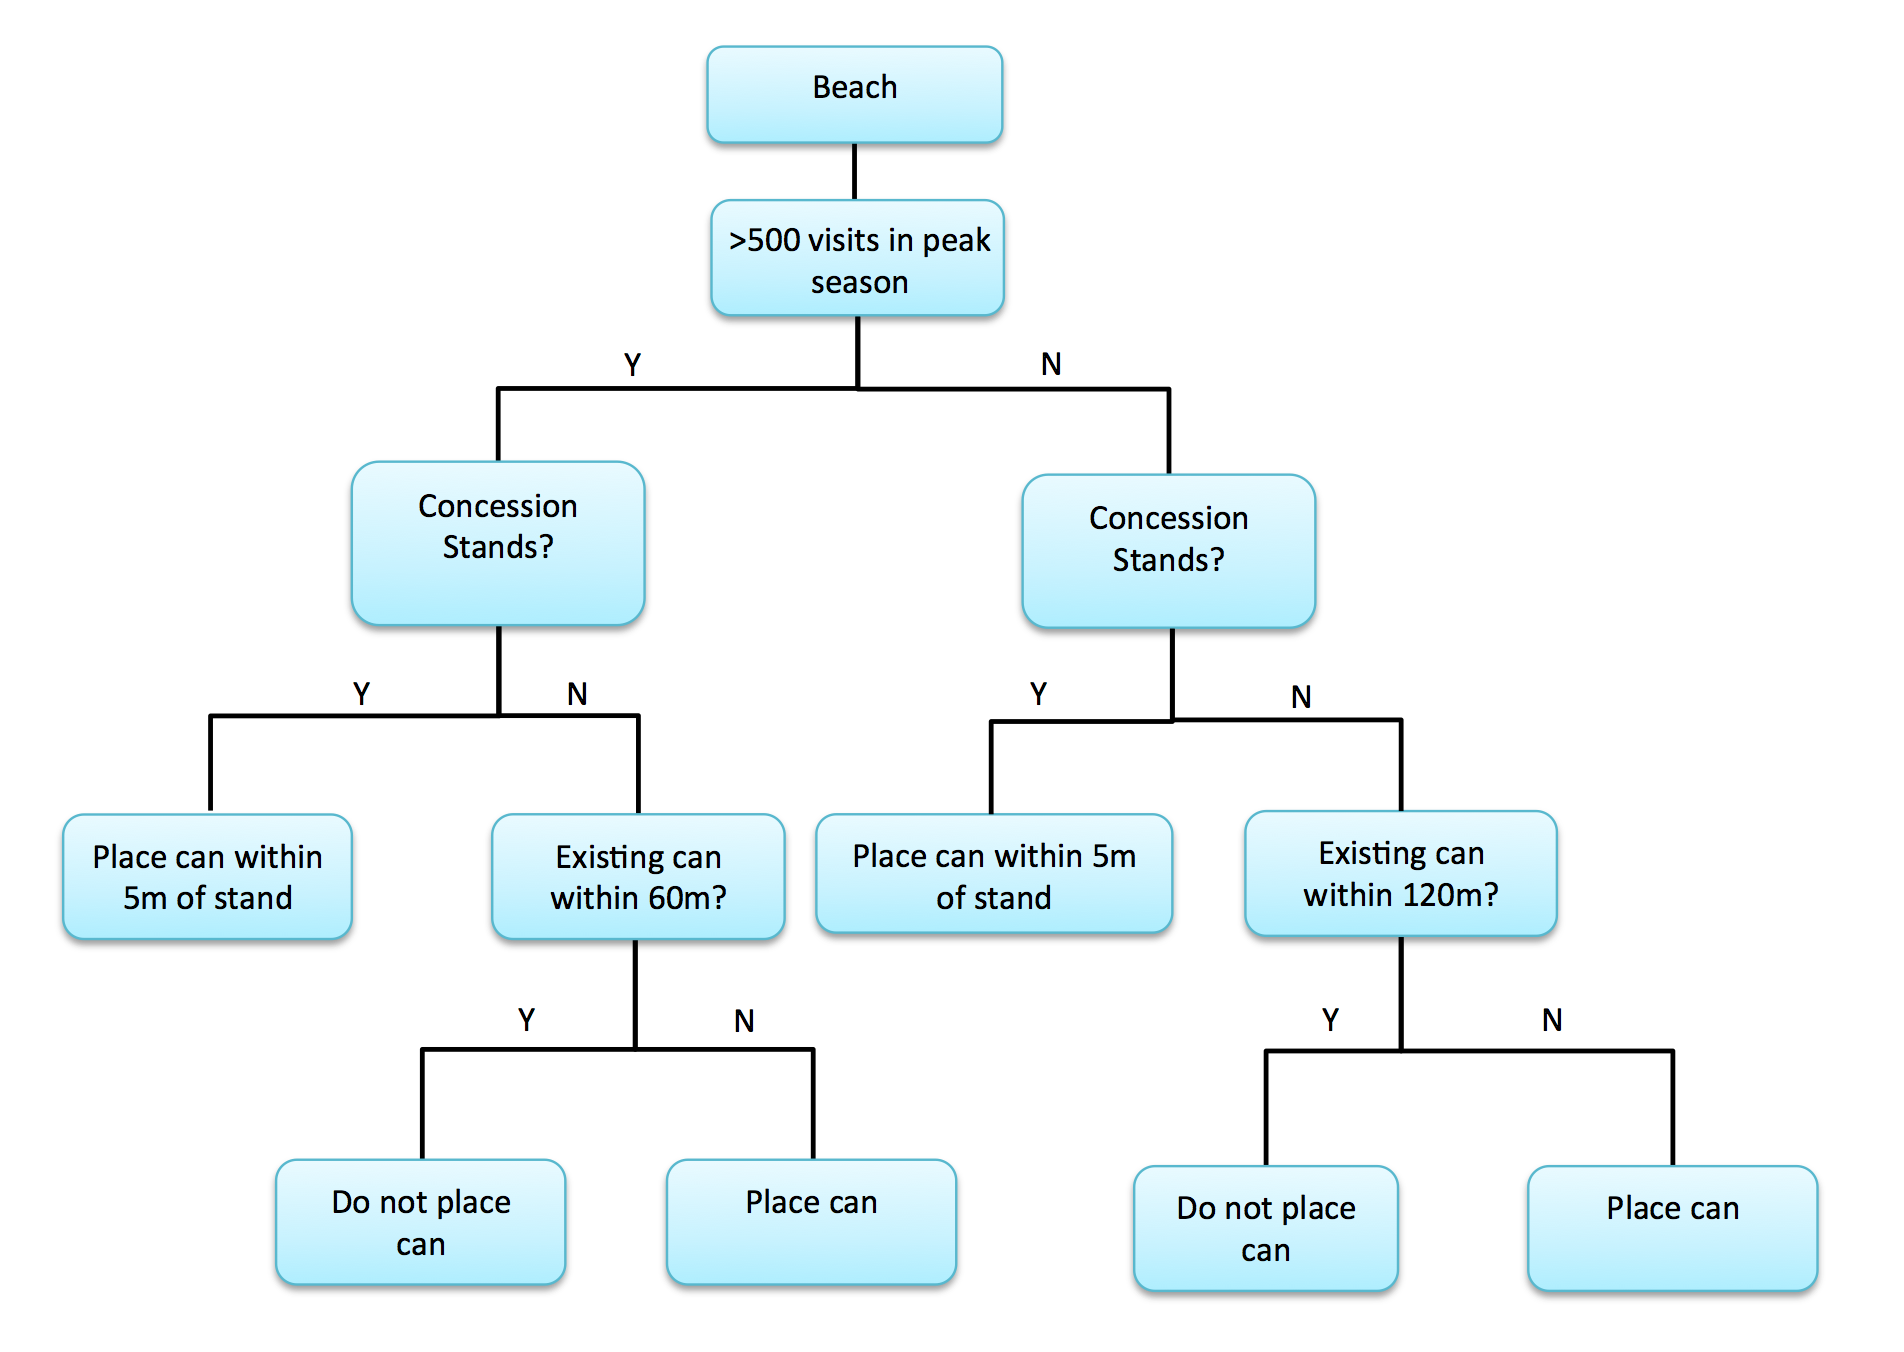
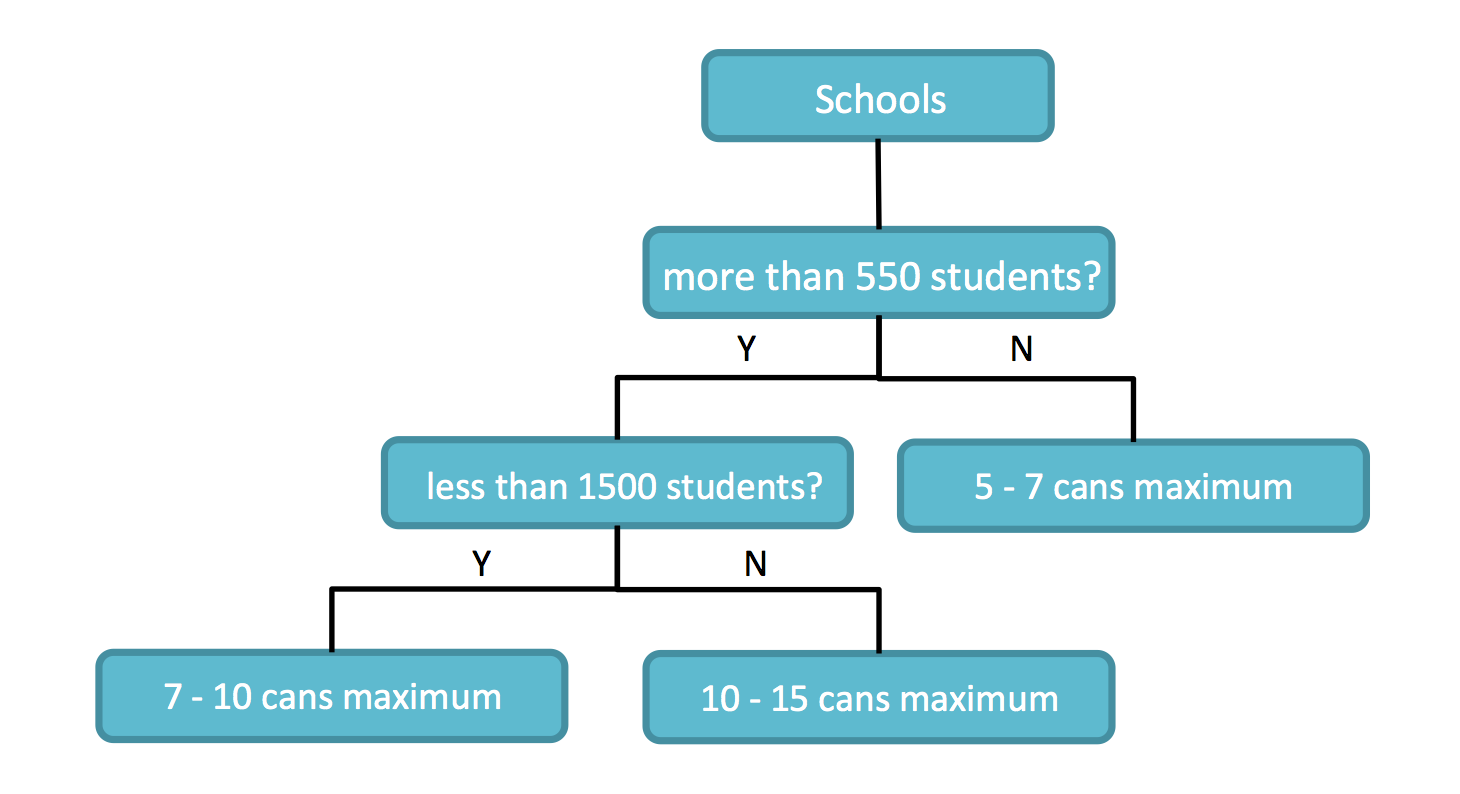
Mona and Shawn were responsible for making the flowcharts for Beaches, Parks and schools. Their methodology in finding the most influential factors was based on the size of the facilities. From their understanding, the larger the facility, the more users, thereby, the more demands for litter cans. For Parks, they considered the determining factor is the size of the park, described in the terms of areas. They also counted in the influence of nearby amenities, which potentially increases the demand for litter cans being placed close to the amenities. When creating the flowchart for Beaches, they took the number of visitors per day at the beach as their major factor; some additional demands came from the food stores that are next to the beach. As for Schools, they looked at the number of students at the school, which fairly described how big the school is, and how many litter cans are demanded.
Below are the decision flow charts for Parks, Beaches, and Schools.
For the creation of the Downtown/Granville Island flowchart, everyone considered mainly placing all 300 large litter cans in the area. The flow chart here was based on all the areas present downtown, such as residential, commercial, beaches/parks and business improvement areas (BIA). A separate flow chart was created for downtown due to the fact that it is very densely populated and visited. This flow chart was ultimately a combination of the commercial, downtown and parks and beaches flowchart which strictly apply for this location.
The resources required for the implementation of this project, such as garbage cans and labor, will be provided by the City of Vancouver. The expected costs will also be provided by the City of Vancouver; the monetary value of the implementation of this project was not given to us.
The estimated time to complete each flow chart will be a week. There are no safety issues that have arose, nor are there any other risk issues. My group has concluded that this project will be a success if it is well received by the client, and if we use it to modify their existing flow chart.
Hi,
All your blogs are clear, really nicely illustrated, and easy to read. The rationale you have included in this blog re the tree diagrams looks sound. Have you seriously considered the underlying assumptions in these decision strategies? Have you thought about where you might be wrong?
Best regards,
SN