What are Low-Carbon Neighbourhoods?
A Low-carbon neighbourhood, sometimes referred to as climate positive development, contributes to the alleviation of stresses and challenges associated with climate change and urban population growth. Low-carbon neighbourhoods help to provide the supporting fabric that leads to the development of low-carbon cities. The C40 Cities Climate Leadership Group loosely defines climate positive development as a means to supplying sustainable net-carbon negative communities for future generations (C40 Cities 2016). Arguably, one of the best ways to achieve low-carbon neighbourhoods is through a collaborative, forward-thinking, and integrated approach to planning, design, and development. It also requires taking an incremental approach to achieving a net-carbon negative result (Connolly 2018). We can begin to understand how we get to low carbon neighbourhoods in cities by asking ourselves the following questions – which are presented in no particular rank or order (C40 Cities 2016):
- Does the neighbourhood prioritize walkability and cyclability?
- Does the neighbourhood contain highly efficient buildings?
- Is the energy supplying the neighbourhood a low-carbon source?
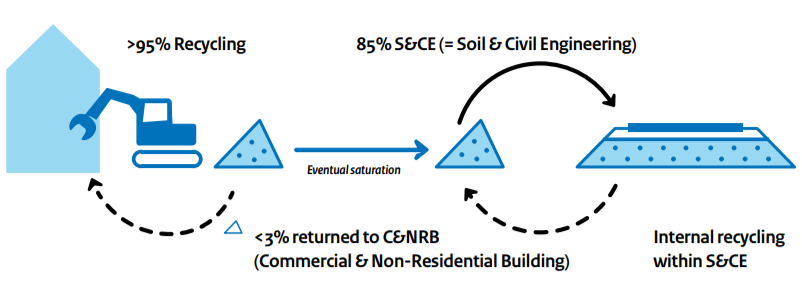
- Does the neighbourhood recycle, and use landfill diversion programs, or use waste as a resource?
- Is the neighbourhood located within close proximity (~10 min) to high quality mass-transit?
- Is the neighbourhood a compact and mixed-use development?
- Does the neighbourhood exemplify positive effects for the neighbouring communities?
If the answer to each one of these questions is Yes, then we can safely say with some confidence that we have arrived at a sustainable and low-carbon solution to neighbourhood development. If the answer is No, then we need to take a deeper look at how we get to net-carbon negative neighbourhoods.
The Six Characteristics of Low-Carbon Neighbourhoods
There are six characteristics that contribute to the overall development of low-carbon neighbourhoods (C40 Cities 2016). These six areas include:
- Walkability and Access to Alternative Transportation Modes
- Density and Mixed-Use
- Building Efficiency
- Renewable and District-Scale Energy Supply
- Waste Disposal, Recycle, and Potential Reuse
- Positive Social and Cultural Impacts
Walkability and Access to Alternative Transportation Modes
Neighbourhoods that highlight alternative transportation modes, such as walking, cycling, ride-sharing, and mass-transit, contribute to fewer emissions overall and promote a decrease in our reliance on single-occupancy vehicle use (Centre for Sustainable Energy 2018). This way of thinking about development is sometimes referred to as transit-oriented development. Low-carbon neighbourhoods prioritize pedestrian-oriented transportation modes over traditional car-oriented transportation modes, in addition to also prioritizing mass-transit. It is the action of building connections between the walking and cycling paths within neighbourhoods and connecting them with major transit routes that helps decrease our dependence on vehicle mobility. It is essential that low-carbon neighbourhoods foster this type of development.
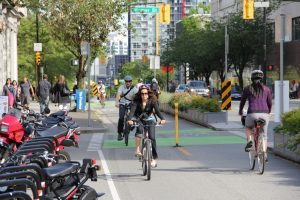
Figure 1: Prioritization of Pedestrian and Bicycle Oriented Transit in Vancouver, BC, Source: Dandyhorsemagazine.com
Density and Mixed-Use Amenities
Low-carbon neighbourhoods prioritize density over sprawl and mixed-use over single-use developments so that they contribute to an overall reduction in GHG emissions. These two development practices grant citizens the opportunity to make better decisions regarding where they work, shop, and play, and how they ultimately choose to get to a chosen destination. It does this in two ways: density and mixed-use. Density contributes significantly to the efficiency of both transportation and waste management systems by providing greater access to these services while also decreasing the distances that are needed to travel between destinations. Mixed-use developments support better access to a greater number of shops, schools, parks, and places of work, which provides a greater choice. It also provides a greater variety in the types of housing, jobs, and businesses within a given community. Combined, these areas work to promote walkability within and between neighbourhoods and enable the connectivity of individuals, amenities, and services.
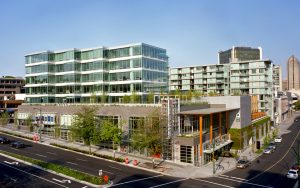
Figure 2: PCI’s Crossroads Mixed-Use Development Project at Cambie and Broadway, Source: PCI Group
Building Efficiency
In Vancouver, the built environment contributes to 55% of the regions GHG emissions (Crowe 2012). One of the ways that we increase energy efficiency in our cities and in our neighbourhoods is through performance-based building design. In performance-based design, clear performance targets are established at the beginning of a project, such as targets that achieve net-zero energy or indoor air quality. This gives developers, contractors, and designers greater freedom to choose the materials and methods that help them to achieve a given performance target. With a performance-based design approach, the final performance targets for a given building are prioritized over the methods and materials needed to get the job done. This is a result focused methodology, and the sustainability of the means and the methods used to achieve these targets should not be neglected. With performance-based design, a greater emphasis is also placed on the comfort, health, and affordability, which includes initial costs and operational and maintenance costs of the building for occupants (Canadian Architect 2018). In British Columbia, the new BC Energy Step Code is intended to shift the industry away from the traditional prescriptive code requirements and towards a performance-based code environment that is more effective at incorporating energy efficiency into our built environment (Government of British Columbia 2018). Adoption of performance-based criteria in building design and construction is integral to achieving low-carbon neighbourhoods.

Figure 3: Example of a Zero Emission Building, Source: City of Vancouver
Renewable and District-Scale Energy Supply
District energy systems centralize the production of heating and cooling for a neighbourhood and can take advantage of the differing energy demand patterns of residential, commercial, and industrial users. They also enable the use of local renewable energy sources and places less demand on gas as a heating source. District energy systems are an effective component of low-carbon neighbourhoods – especially when considered within a dense and diverse urban context. When combined with a supply of renewable energy, their use quickly becomes essential. The City of Vancouver establishes guidelines for district energy that establish five key areas for achieving a successful district energy project, these areas include:
- Climate Protection
- Air Quality
- Neighbourhood Fit
- Sustainability of Fuel Sources
- Community Engagement
When implemented successfully, district energy systems have the potential to reduce infrastructure needs, emissions, and costs (Crowe 2012). An example of the successful implementation of a district energy system is at the LEED platinum neighbourhood development of Dockside Green in Victoria, BC. The energy system at Dockside Green is being phased out over the life of the neighbourhood as it grows. Currently, the system uses natural gas to heat water delivered at the district scale for residential, commercial, and industrial clients. As the size of the neighbourhood increases over time, the system will incorporate a wood gasification process in addition to a sewer waste heat recovery process (Dockside Green Energy LLP 2008). Renewable and district-scale energy systems are an important component that is worthy of consideration as we shift towards low-carbon neighbourhoods.
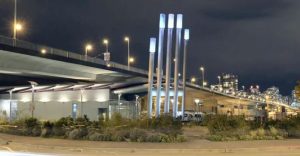
Figure 4: Southeast False Creek Neighbourhood Energy Untility, Source: AME Group
Waste Disposal, Recycle, and Reuse
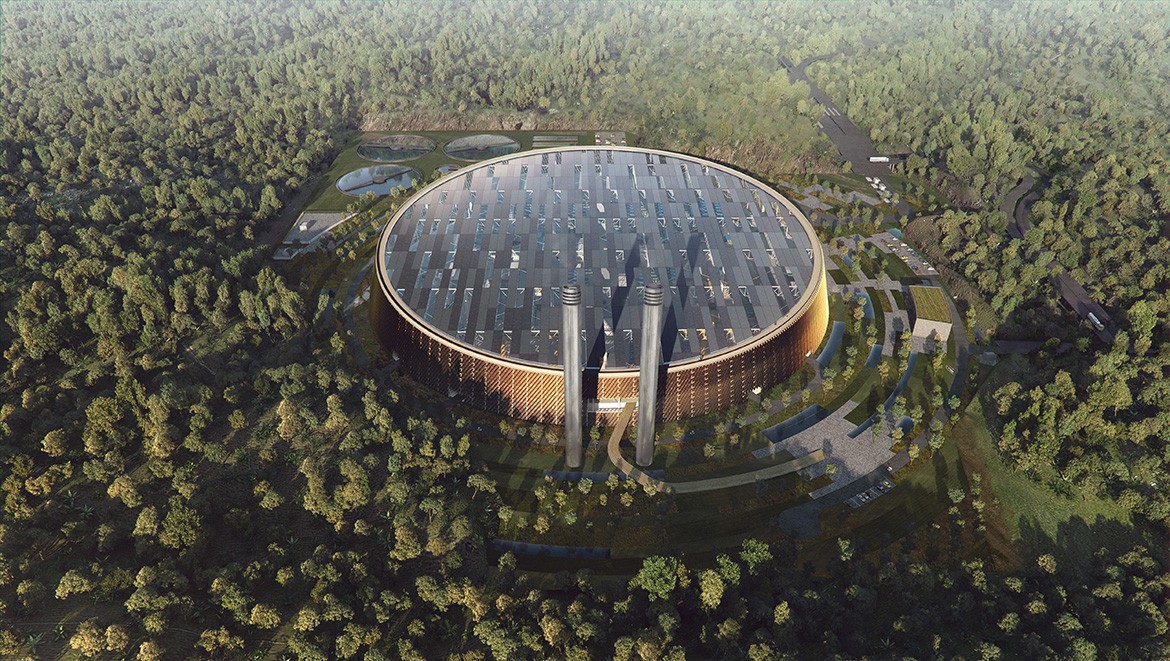
Low-carbon neighbourhoods work to reduce their carbon footprint resulting from waste. This includes determining sustainable solutions to how the waste is disposed, how and if it is recycled, and in exemplary cases, how and if it can be captured and reused as an energy source. Covanta Burnaby is Metro Vancouver’s answer to providing energy-from-waste. The Covanta Burnaby project takes 25% of Metro Vancouver’s post-recycled waste and converts it to energy that is supplied back to local customers. The system is capable of processing 850 tons of waste per day and generating 170,000 MWh of electrical energy (Covanta Holding Corporation 2018). Not only is waste reuse contributing to renewable energy sources in the community, but it also reduces the amount of waste headed to local landfills.
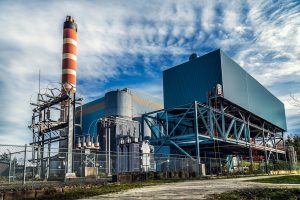
Figure 5: Metro Vancouver’s Waste-to-Energy Facility in Burnaby, Source: Hiveminer.com
Positive Social and Cultural Impacts
Low-carbon neighbourhoods contribute to job creation, public health, social inclusion, and improved accessibility within their own communities as well as neighbouring communities. To effectively fit within a sustainability framework, low-carbon neighbourhoods must prioritize, in addition to the other five categories, the social and cultural implications of the development as a whole. According to Gouldson et. al., opportunity to increase the social and cultural benefits of neighbourhoods exists within the building, transportation, and waste management sectors. Research by Gouldson et. al. shows that the energy-efficient residential and commercial building sector is capable of increasing human health through improved air quality and improved productivity for occupants. Their research also shows that the energy-efficient transportation sector contributes to job creation, productivity, and an increase in overall human health. Further, the research shows that green waste management significantly contributes to increased human health and well-being through reduced pollution while also contributing to job growth and employment opportunity (Gouldson, et al. 2018).
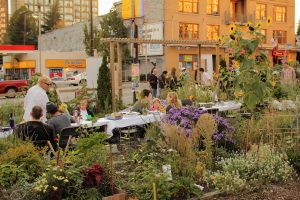
Figure 6: Davie Street Community Garden in Vancouver BC, Source: Vancouver Community Garden (Wikipedia)
How We Get to Low-Caron Neighbourhoods
We get to low-carbon neighbourhoods by considering the many parts that make up a neighbourhood. We can take this a step further and include the component parts that make up the six characteristics described above. I believe that we get to low-carbon neighbourhoods by asking ourselves the seven questions identified at the beginning of this article. I also believe that if we can start to achieve low-carbon neighbourhoods that we are well on our way to achieving low-carbon cities.
Sources
BC Climate Action Toolkit. 2018. District Energy Systems. https://www.toolkit.bc.ca/tool/district-energy-systems.
C40 Cities. 2016. Good Practice Guide: Climate Positive Development. London; New York; Rio de Janeiro: C40 Cities: Climate Leadership Group.
C40 Cities: Climate Leadership Group. 2017. How sustainable neighbourhoods are the building blocks of green, climate-safe cities. 07 11. https://www.c40.org/blog_posts/sustainable-neighborhoods-july.
Canadian Architect. 2018. Green Building coalition pushes for performance-based building codes. 07 26. https://www.canadianarchitect.com/sustainability/green-building-coalition-pushes-for-performance-based-building-codes/1003743695/.
Centre for Sustainable Energy. 2018. Low-carbon neighbourhood planning: A guide to creating happier, healthier, greener communities. Bristol: Centre for Sustainable Energy.
Connolly, Joannah. 2018. Q&A: Is building low-carbon neighbourhoods sustainable? 09 28. Accessed 11 2018. https://www.vancourier.com/real-estate/q-a-is-building-low-carbon-neighbourhoods-sustainable-1.23446235.
Covanta Holding Corporation. 2018. Covanta Burnaby. https://www.covanta.com/Our-Facilities/Covanta-Burnaby.
Crowe, Brian. 2012. Vancouver Neighbourhood Energy Strategy and Energy Centre Guidelines. Policy, Vancouver: City of Vancouver.
Dockside Green Energy LLP. 2008. Renewable Energy and a Zero Carbon Footprint. http://docksidegreenenergy.com/carbon_footprint.html.
Gouldson, Andy, Andrew Sudmant, Haneen Khreis, and Effie Papargyropoulou. 2018. The Economic and Social Benefits of Low-Carbon Cities: A Systematic Review of the Evidence. Review, London and Washington: Coalition for Urban Transitions.
Government of British Columbia. 2018. How the BC Energy Step Code Works. https://energystepcode.ca/how-it-works/.
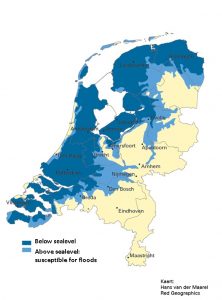
 (Source: “Ahead of Storm”, 2008)
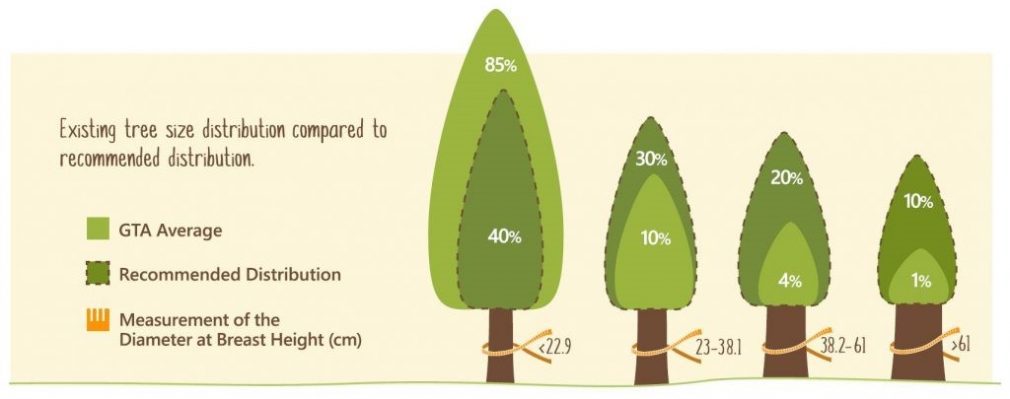 (Source: Green Infrastructure Ontario, GIO, 2016)