“I spy with my little eye… a District Energy System”

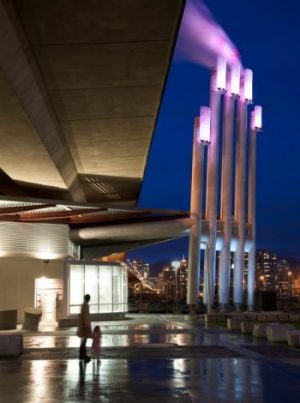
To many, these stacks are just part of a public art installation situated east of the Cambie Street bridge but if you look a little closer, you will see they are part of the Southeast False Creek Neighbourhood Energy Utility. The five stacks, which resemble a hand reaching up, are actually exhaust flues for the False Creek Energy Centre and the LED lights making up the ‘fingernails’ change colour according to the amount of district energy being produced by the system.
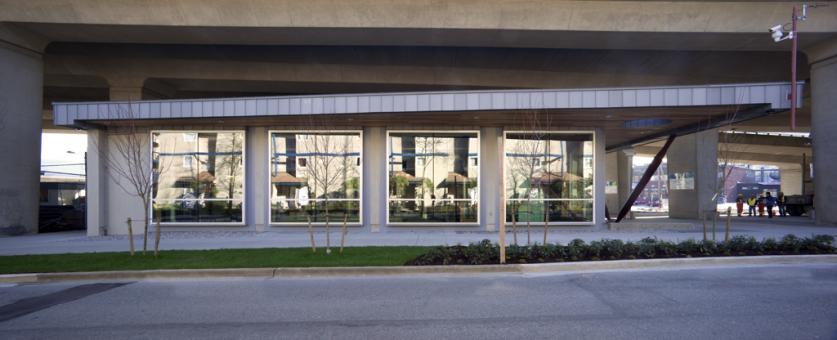
So why pair a public art display with a Neighbourhood Energy Utility? To help bring attention to a first-of-its-kind Neighbourhood Energy system in North America that captures waste heat from raw sewage to provide centralized space heating and hot water to the surrounding buildings in the Olympic Village neighbourhood. At the time of its construction, only three similar systems had been implemented in the world, two in Oslo, Norway and one in Tokyo, Japan. By recycling waste thermal energy, the system is reducing 60% of the pollution associated with heating and hot water use that would otherwise be produced by the neighbourhood’s buildings. Attention to the energy centre is also sought from passer-by’s by the large windows incorporated into the building allowing people to see the system in action.

The importance of Neighbourhood Energy systems is evident when you take a look at the numbers for energy consumption in Vancouver. Buildings, including residential, commercial, institutional and industrial, account for three quarters of the energy consumed by the city, which contributes to significant negative effects on the city’s carbon footprint. This also means that taking steps to reduce the non-renewable energy reliance of space heating and hot water, the two largest contributors to energy consumption in buildings, can have real and significant positive effects on the impact of buildings on the environment. The Southeast False Creek Neighbourhood Energy Utility falls in line with the third priority laid out in Vancouver’s Renewable Energy Strategy 2015-2050: expand existing and develop new neighbourhood renewable energy systems. Following suit, development of Neighbourhood Energy systems in South Downtown, Northeast False Creek, and in River District have been pursued. The City has also identified several other districts suitable for Neighbourhood Energy, all of which are large, high density areas or corridors with high development potential. These districts include downtown, central Broadway and the Cambie corridor.

The benefits of Neighbourhood Energy are clear but new technology still requires extensive educating and consultation for it to be widely supported by neighbourhood stakeholders. However, with increased public awareness of where our energy comes from, such as promoting learning through the use of public art, the hope is that more and more people will begin to realize that renewable energy sources exist right in our own backyard, or in this case, right in our own sewer system!

References

Project Website

Renewable City Strategy 2015-2050

Neighbourhood Energy in Vancouver – Strategic Approach and Guidelines

Image 1

Image 2

The Dutch View Rising Sea Level as Opportunity, Rather Than Threat

In the Netherlands, a country that largely lies below sea level, an innovative approach to urban storm water management is not just an achievement, but a necessity. The Dutch have a unique view of their situation and choose to “live with the water, rather than struggle to defeat it.” In fact, the special relationship with water develops at a young age for those who grow up in the country, as children are thrown into the pool fully clothed to earn a swimming certificate. The fact that flooding is a major threat to the country is approached head on with a combination of Dutch ingenuity and determination.

Low Impact Design 

The Dutch hold the view that traditional flood barriers and storm water management practices are not adequate to address the rising tides brought on by climate change. Their solution is to let the water in, where possible, rather than continuing to build up and against it.

The Dutch devise lakes, garages, parks and plazas that are a boon to daily life but also double as enormous reservoirs for when the seas and rivers spill over.”

Water Plaza Rotterdam: A community space where people and water coexist
LID mimics the natural water system for collection and drainage of storm water

A keen example of this low impact design for storm water is the Water Plaza in Rotterdam, a public space that has been designed as a community hub but also features sunken infrastructure and green, pervious areas to sustainably collect rain and storm water and provide drainage.

Making Room for the River

The Dutch are using concepts of integrative water management and low impact design to redesign cities and “make room for the river.” Instead of building flood defences higher, the Dutch are actually taking on the task of removing these barriers to provide room for swelling rivers. The benefit of this is two-fold: sustainable flood management combined with generation of urban living space.

The redesigned River Waal provides room for river swells and an island with riverside park

The room for the river concept re-generates the connection between local communities and the natural water ecosystem by developing urban river parks and recreation along the rivers. Banks of the River Waal have been constructed as large gradual slopes, both increasing the floodplain and providing space for water infiltration and communities to gather along the river.

Bringing the Dutch Model to Canada

The province of Alberta, like many other regions worldwide, are excited about what the Dutch are doing to prepare for flooding. In response to the terrible floods in 2014 in Calgary, Alberta, the province has closely collaborated with Dutch water authorities to implement Room for the River integrative water management practices right here at home in Canada!

References:

“How the Dutch Make ‘Room for the River’ by Redesigning Cities.” Scientific American: https://www.scientificamerican.com/article/how-the-dutch-make-room-for-the-river/

“The Dutch Have Solutions to Rising Seas. The World is Watching.” The New York Times: https://www.nytimes.com/interactive/2017/06/15/world/europe/climate-change-rotterdam.html?_r=0

Ruimte voor de rivier website: https://www.ruimtevoorderivier.nl/english/

Alberta’s Room for the River Approach: https://albertawater.com/how-is-water-governed/what-is-room-for-the-river

Water Plaza Rotterdam: http://www.publicspace.org/en/works/h034-water-square

Images 1 & 2

Image 3

Image 4

The Generation, Composition, and Management of Urban Solid Waste in Beijing

Beijing is the capital of China, and the largest city in northern China. In recent decades, Beijing has progressed rapidly in economic development and urbanization. However, municipal solid waste has become one of the significant environmental problems in the city. This article aims to provide an overview on Beijing’s urban solid waste management with regard to its generation, composition and management.

Generation and trend of municipal solid waste

According to the data published by Beijing Statistics Bureau, it is demonstrated that the amount of disposed solid waste in Beijing increased steadily over the past two decades, from 2,800 thousand tonnes in 1995 to 7,903 thousand tonnes in 2015. A multi-regression analysis shows that GDP is identified to be the strongest explanatory factor for the growth of the total solid waste amount in Beijing, indicating that the environment has been paying the price for the economic growth.

Composition of urban solid waste

From table 1, it is shown that solid waste composition has been found to be relatively stable. Food waste always comprises the highest proportion except in 1990, and its representation has an increasing trend. Plastic, paper and ash also occur in relatively high proportions.

Table 1 Composition (%) of urban solid waste from 1990 to 2003 in Beijing

Municipal solid waste management

There were 22 treatment establishments for solid wastes in Beijing in 2004, and the number has increased to 28 in 2016. Sanitary landfill is the main treatment approach of municipal solid waste, while composting and incineration only make up small proportions. Recent research results indicate that the treatment capacity of the treatment plants proves to be insufficient as the capacity can not satisfy the need of treatment. In addition, the traditional landfill practice produces a large amount of greenhouse gases, and some of the pungent gases are poisonous. In order to mitigate the health risk for the population near the landfill, a proper collection and venting system need to be created.

Discussion

The solid waste management in Beijing has been greatly improved during the past decade. However, problems remain in respect of domestic garbage reduction, resource utilization and industrialization. Future challenges for the local government include the implementation of an effective waste minimization program, systematic urban solid waste management;; and improvement in data availability in monitoring the characteristics of municipal solid waste.

Public-Private-Partnership

Public-Private-Partnership

Quick Review about PPP in Green Infrastructure:

As mentioned in this week’s BRISTOL case study. To build the green infrastructure, especially for the very large city-wide green infrastructure projects, PPP (Public-Private-Partnership) is a very commonly used arrangement nowadays. There are many types of PPP arrangements, such as BT (Build-Transfer), TOT (Transfer-Operate-Transfer), BOT (Build-Operate-Transfer) etc.

Generally speaking, PPP is a cooperative arrangement between the government and private companies on the construction of city infrastructures. All sectors will sign the contract to clear the rights and obligations to ensure the infrastructure completed successfully, and achieve the final results that could not be obtained by unilateral actions. All risks and profits will be shared. The PPP cooperation could not only be limited in the national level, but it could also be the worldwide cooperation, for example, there are many green infrastructure projects participated by a couple of countries’ governments and private funds by using PPP arrangement in Asian. I made the following picture to show you the relationship among key players and their functions.

Figure 1.  Relationship and functions of key players


SWOT Analysis on PPP:

SWOT model can be applied to analyze the PPP arrangement, and identify how PPP is related to green infrastructure.

Strength:

The PPP is just started and green infrastructure market is very flexibly demand-orientated, the private companies could adapt to the market easily. The government usually has large financial pressure on high-cost green infrastructure projects, so that they introduce the private sectors to help the construction, and authorize the private sectors with the operation rights to generate profits. As the partner of the government, the private sectors could have less financing difficulties with a bank or other institutions. Private companies can use more advanced skills to manage the resources efficiently compared with the government, and they have more new planning ideas and practical patent technologies about green infrastructure. PPP is a win-win arrangement.

Weakness:

Compared to the government, private sectors have less bargain power and less risk affordability. PPP projects usually have longer negotiation period because of different concerns for different sectors. The negotiation cost would be a large portion of the total green infrastructure cost.

Opportunity:

Because PPP is a really fresh innovation and green infrastructure is a long-term plan, the market demand is still very huge. As PPP is win-win for both sectors, PPP arrangement gets supported and develops very fast, for example, PPP fund and projects have grown to 244 Billion US Dollars just in half a year period from 2016 December to 2017 June in China. For Green Infrastructure and relevant industry, PPP will become the first choice. Our Civil Students should be equipped with PPP knowledge, and it will also be our opportunity to achieve something in this field.

Threaten:

For high-tech green infrastructure plans and new sustainable ideas, the complex government examine and approval processes could depress some private companies, which means we would loss many opportunities to show our capabilities. The relevant laws and regulations are not well-established, which could affect our work in the near future. Another important point is from the public views, because the public opinions could make a big difference on green infrastructure decisions.

If you like this post, or you think it is helpful somehow, please up-vote. I would like to discuss and share more ideas about PPP with you.


Reference:

Retrieved September 22, 2017, from http://www.bridata.com/front/index

Retrieved September 22, 2017, from http://www.zeidei.com/article/1526895.html

Issues Surrounding Scientific Research of Green Infrastructure (GI)

Our education at UBC has an intentionally fragmented setup which might make it challenging for us to see the interconnections between the various fields of Civil Engineering, and the opportunities available for us, as Engineers to optimize the systems for an ecological and human benefit. Green Infrastructure is one of the primary topics covered in CIVL 498A. It is a very broad concept spanning various fields of Civil Engineering from Transportation, to Structural Engineering, to Stormwater Control. Various components of GI are shown in Figure 1 below.

Figure 1: Visible Benefits of Green Infrastructure

This blog post summarises the issues surrounding scientific research of Green Infrastructure (GI), as covered in detail here. It is meant to be a compliment to the article, and I highly recommend reading the article in its entirety. The following are the challenges in studying GI from a research perspective.

·        GI features and/or elements

GI encompasses a wide variety of areas from ponds, to green roofs to bee hives (as shown in Figure 2). Monitoring the effects of these GI elements is difficult, if not impossible. GI elements such as green roofs are easier to study and monitor, and hence, garner more attention.

Figure 2: Beehives – Mutual Benefits

·        Cost and benefits of GI

Costs are divided between the Financial costs & Opportunity costs. The resources used on constructing the GI elements are considered Financial costs. The benefit that would be obtained from those resources spent elsewhere would be considered the Opportunity cost. GI is most effective when thought of while improvements in present infrastructure are being made. For example, incorporating wildlife corridors when overhauling a highway system.

Benefits of GI are more qualitative than quantitative. Some indicators of GI benefits are: the quality of green spaces, the amount of sequestered carbon, the increase in employment after GI implementation. Figure 3 below attempts to describe the qualitative values of GI.

Figure 3: Total Economic Value

·        Evaluating GI

The main goal of GI is the protection of ecological functions while simultaneously benefiting humans. When a GI element does not provide one of the two, or favors one over the other, that is an indicator of a poorly designed GI element. Policy, guidelines and standards are needed before any serious evaluation of GI can be undertaken.

·        Multi-level evaluation

Since GI can be of different scales, it might be more effective to take a Systems Thinking approach. Additionally, analyzing not just the GI alone, but the institutions that manage (government agencies, etc) and use (transportation agencies, etc) these systems should be undertaken.

 Conclusion

I believe that bringing to light the challenges in studying GI will lead to development of qualitative as well as quantitative methods of measuring GI impacts. As future Engineers, by knowing these challenges, we might be able to better justify implementing GI in our projects when posed with questions about their benefits.

 References:

Figure 1

Figure 2

Figure 3

Exploring Sustainable Leadership: Andy Hargre

The video discusses a study that was done to look at changes within education over a period of approximately 30 years. Specifically, they considered when schools faced many changes, what changes stayed and what changes disappeared. Through this analysis, they would come up with why some changes stayed over others.

There was a total of 8 schools that were examined. Four in Canada and four in New York state, all of which were high schools. The school’s styles varied between traditional and innovative. Interviews with the teachers and leaders, documents of the school district, surrounding policies and changes and reforms within the schools themselves were all analyzed. Each school was broken down into six broader themes which showed there was a clear shift within the six themes all at the same point in time. Through these themes 7 interrelated principles of sustainability and non-sustainability were determined:

  1. Depth- To be sustainable, there must be focus on something that is important and people must care about the change that is trying to be made.
  2. Endurance- The changes need to be maintained beyond one leader. To be sustainable, the changes should be able to be transferred to successive leaders.
  3. Responsibility- The change needs to be a shared responsibility, no one person can do all of it on their own.
  4. Social justice- How does one change affect the changes going on in other places needs to be considered especially in terms of the environment.
  5. Diversity- Strong environments are bio-diverse rather than standardized.
  6. Energy- Energy needs to be renewable to be maintained in the long run
  7. Conservation- The changes considered should preserve the good things done in the past and learn from the mistakes.

These principles mentioned in the video are in line with the common strategies for developing sustainable leadership. This is interesting because it shows the broader application of these principles and how they can be applied to different fields. To implement sustainable changes, it is important to consider all the principles discussed in the video and in the lesson plan. Some of the highlights that I think are important to mention is that change is a shared responsibility. To make an effective move toward a sustainable change, you can lead it but it is not solely up to you. It is important to present the idea in a way to demonstrate why it is important to make the change and in doing this show how it is a community responsibility. While emphasising the importance of shared responsibility, it is important to implement changes that can be done through various leaders. This will increase the likelihood the changes made will stick. All of the aspects discussed are important to consider while we begin our careers and try to become a sustainable leader.

(https://www.youtube.com/watch?v=Jkry2I050wIaves, Boston College)

Index of Ecological Importance

T O P I C   O V E R V I E W

This week I decided to read a selection of the book “Sustainable Infrastructure : The Guide to Green Engineering and Design” by S. Bry Sarte. This reading investigated  applications of sustainable infrastructure and explored several case studies in order to demonstrate these applications. I found the case study of development on Isla Pedro Gonzalez (known locally as Pearl Island) in the Gulf of Panama to be particularly interesting. As the book discusses, islands make great examples for sustainability case studies as it is easy to see and appreciate that resources are limited, and to define the system boundaries. One can clearly observe the effort required to transport resources to and from the island, and see the trash piling up on the island’s beaches and in surrounding waters.

Pearl Island is unique in that a master plan for development on the island was developed by a team of local residents and stakeholders, engineers, ecologists, architects, and community planners prior to significant human habitation, development, and use. This allowed the island to be developed sustainably from the ground up with all environmental factors considered, without having to modify an existing poorly developed site. Many interesting and useful design strategies were employed in throughout the development of the master plan and are discussed at length in the book. However, I found the idea of an “Index of Ecological Importance” particularly intriguing.

capture2

Figure 1: Looking out towards Isla Pedro Gonzalez (Pearl Island) in the Gulf of Panama

The index of ecological importance is a design approach developed as a starting point for understanding the relative value of the green infrastructure system on a project site. The intent of the index is to provide an overview of these conditions and opportunities, identify areas which are most critical (no development allowed) and critical (employ environmentally responsive design techniques), and to establish a framework for biological connectivity between these areas and the surrounding area. Once developed, the index is then used to inform all other development plans, and as a general guide through the master planning process – focusing development with greater impact away from critical habitats, and ecologically sensitive areas. In order to ensure they achieved the most accurate model possible, as the project team for Pearl Island’s understanding of the island’s ecosystems improved, the index was continually updated and re-evaluated. Looking forward to future projects, I think this list could be expanded to include areas which provide ecosystem services in order to minimize their loss through to human development and preserve critical ecosystem functions.

In order to develop an index of ecological importance, a decision matrix is created which assigns relative value to specific known physical and ecological conditions on the island (or any subject area). Ecological data such as slope analysis (to asses the impact of deforestation on slope stability and resulting dirty surface runoff into surrounding bodies of water), a vegetation survey, existing development, waterways, and mapping of critical bird and wildlife habitats can be included as the analysed data sets. This sets of data are then weighted by relative importance and layered to for a single map of ecological importance for the subject area. This transformation of the environmental data and relative comparison of ecological importance into a physical space can be used to inform decisions regarding the impact and placement of buildings, infrastructure, and other development. An example of this map or index of ecological importance for Pearl Island can be seen below.capture

Figure 2: Index of Ecological Importance on Pearl Island. Darker areas are most critical.


S U G G E S T E D   A S S I G N M E N T

In order for students to learn about the concept Indices of Ecological Importance an assignment such as the following could be completed.

Part One: Reading

Students would be asked to complete a reading on Indices of Ecological Importance. Pages 300-302 of S. Bry Sarte’s Sustainable Infrastructure : The Guide to Green Engineering and Design would be appropriate.

Part Two: Questions

Students would be asked to complete the following questions:

  1. In your own words, summarize the concept of Indices of Ecological Importance in a few sentences.
  2. What are some of the benefits of this approach?
  3. For which types of projects would this approach be most appropriate?
  4. Are there projects where this approach would not be appropriate? Explain.
  5. Name at least two ways in which this design approach could be improved.

Part Three: Create an Index of Ecological Importance

Students would be given a sample area and development project for which to create an Index of Ecological Importance. A map of the area would be provided. Students would be expected to come up with a list of at least ecological conditions or data sets, and then create a decision matrix to weigh the relative values of these criteria. Finally, students would be asked to create a rough map of the ecological importance of the site based on their decision matrix and the map provided.


R E F E R E N C E S

Sarte, S. B., Mr. (2010). Sustainable Infrastructure: The Guide to Green Engineering and Design. Hoboken, NJ: John Wiley & Sons.


Closer Look Into Green Streets


Green Streets

The traditional design of streets is created of an impervious surface can make large amount of runoff when it rains. As the water runs along the surface it can pick up pollutants that then enter the water system. The water system can either be two separate systems: one for stormwater and the other for sanitary water or it can be a combination of the two. Either way some of these systems can’t handle the large peaks of runoff which a rain storm can produce. These volumes cause overflowing of basins and catchments which can leads to high volumes being released into the environment which can be very harmful. One of the ways to manage these high volumes and contaminant release is implementing green streets. Green Streets are a good example of how sustainable site planning can be implemented to create many benefits to a system that is already in place but can at some times be harmful to the environment. There are many sustainable benefits to Green Street which can be seen in the following list:

  • Improving water quality, air quality, temperature, aesthetics and safety
  • Reduce the peak flows that impact the underground storm water infrastructure
    • Smaller and fewer pipes and less maintenance
  • Help prevent flooding
  • Improving, restoring and protecting water as a resource
  • Promote alternative surfaces
  • Promote renewable energy for street lights
  • Reducing heat that radiates from the hard surfaces
  • Promotes more appealing pedestrian use by being more walk-able, safe and attractive
  • Sense of place, higher livability

The following are some examples of what the infrastructure that might be included in a Green Street:

  1. Porous pavement

Porous pavement could be made of pervious concrete, porous asphalt or permeable interlocking pavers. Implementing porous pavement infiltrate, treat and store runoff. It can be cost effective where land values are high and flooding and icing is a problem.

picture-1

(http://njwsawpu.blogspot.ca/2011/06/permeable-pavement-epa.html)


  1. Vegetated Curbs and sidewalks

Adding more vegetation will result in more of the rainwater being absorbed into the soil rather than being put in the stormwater system. Absorbing the water filters contaminants out of the water stops the contaminants from being released into the environment as well as reduce the peak flow volumes.

2

(http://www.deeproot.com/blog/blog-entries/the-rise-of-the-curb-cut-part-two)


  1. Planter Boxes

Planter boxes are garden with vertical walls and either have open or closed bottoms. These can collect and absorb runoff from sidewalks, parking lots and streets. They are ideal for space-limited sites in dense areas.

3

(http://www.lastormwater.org/blog/2015/01/university-park-rain-gardens-to-grow/)


  1. Rain garden: Biowales

Biowales are vegetated, mulched or xeriscaped channels that provide treatment and retention as they move stormwater from one place to another. The vegetated swales slow, infiltrate and filter the flow of stormwater. This system is well suited along the sides of streets and parking lots.4

(http://www.bizjournals.com/portland/blog/sbo/2014/01/world-cities-looking-to-portland-for.html)


  1. LED Lights

Implementing LED lights into the street lights will reduce the energy used to light the streets while also, providing a brighter environment at night. This can be an example of how implementing green streets can promote the use of renewable energy.


An Example of Implementations:

Philadelphia has multiple projects that were implement all over the city. One of them is the Queen Lane Water Treatment Project. They implemented vegetated curb extension that protrude into the street creating a new curb. This curb is made of a layer stone topped with soil and plants. The curb design allows the runoff to flowing into the vegetation area so the plants can store and filter the runoff. Excess runoff can flow into the existing inlet which leads to the treatment plant. As well there is a downspout planter which allows the runoff from roof gutters to flow through the plants, which has the similar benefits as the curb design discussed above.

5

(http://www.phillywatersheds.org/what_were_doing/green_infrastructure/projects/QueenLane)

For more examples of other green street implementation in Philadelphia refer to their Green Streets Programs (http://www.phillywatersheds.org/what_were_doing/green_infrastructure/programs/green_streets).


Resources:

https://www.youtube.com/watch?v=TxqxEqnHIKw&app=desktop

https://www.epa.gov/green-infrastructure/what-green-infrastructure

http://www.phillywatersheds.org/what_were_doing/green_infrastructure/projects/QueenLane


Constructed Wetlands I

One of the alternative solutions to wastewater treatments that are widely used nowadays are the constructed wetlands. These wetlands are shallow pools developed specifically for storm or waste water treatment that create growing conditions suitable for wetland plants. They are great alternatives to remove contaminants from wastewater, and have been used for decades now.
Constructed wetlands have the same properties as natural wetlands, and are designed to provide water quality benefits through various process that will ultimately minimize pollution prior to the water entry to streams. They also act as biofilters, and remove sediments and pollutants such as heavy metals from the water, and can even serve as wildlife habitat even though that is outside the scope of its main purposes.

There are 2 types of constructed wetlands:

Surface Flow Systems (Free water surface):

A surface flow constructed wetland have standing water at the surface, and can be used as a tertiary treatment facility at a wastewater treatment plant. This system consist of a basin full of water, and macrophytes roots planted that emerge at the water surface. The effluent water is treated as it flows over the soil, and organic material is removed through microbial degradation.

The figure below shows a surface flow constructed wetland.

2016-11-02-12

Subsurface Flow Systems:

Subsurface systems have no visible standing water, and are designed so that the wastewater flows through a gravel substrate beneath the surface vegetation.The wastewater passes through a sand medium on which plants are rooted. A gravel medium (generally limestone or volcanic rock ) can be used as well and is mainly deployed in horizontal flow systems though it does not work as efficiently as sand.
In the vertical flow constructed wetland, the effluent moves vertically from the planted layer down through the substrate and out. In the horizontal flow CW the effluent moves horizontally, parallel to the surface.

The figure below shows a subsurface flow constructed wetland.

2016-11-02-14

Constructed wetlands are then extremely important to wastewater and play a big role in gray water systems. Just like other major systems, they include all components necessary to the efficient treatment of gray water such as: collection of water, treatment, disinfection, and distribution.

References:

http://www.ces.uoguelph.ca/water/NCR/ConstructedWetlands.pdf

https://www.epa.gov/wetlands/constructed-wetlands

http://www.gov.pe.ca/photos/original/eef_wildlife_p1.pdf

Constructed Wetlands II

This weeks learning, titled “Design for Water conservation and Waste-Water management” explored how the ecosystem approach to urban infrastructure design required engineers to consider the whole water cycle. That allows us as engineers to  build infrastructure that restores the natural balance of water in ecosystems.  While much of the reading was highly applicable and interesting, I was particularly intrigued by the idea of constructed wetlands and decided to investigate this topic further.

4130876_orig
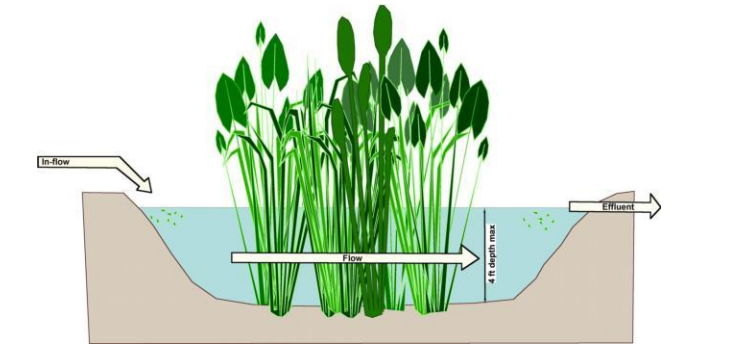
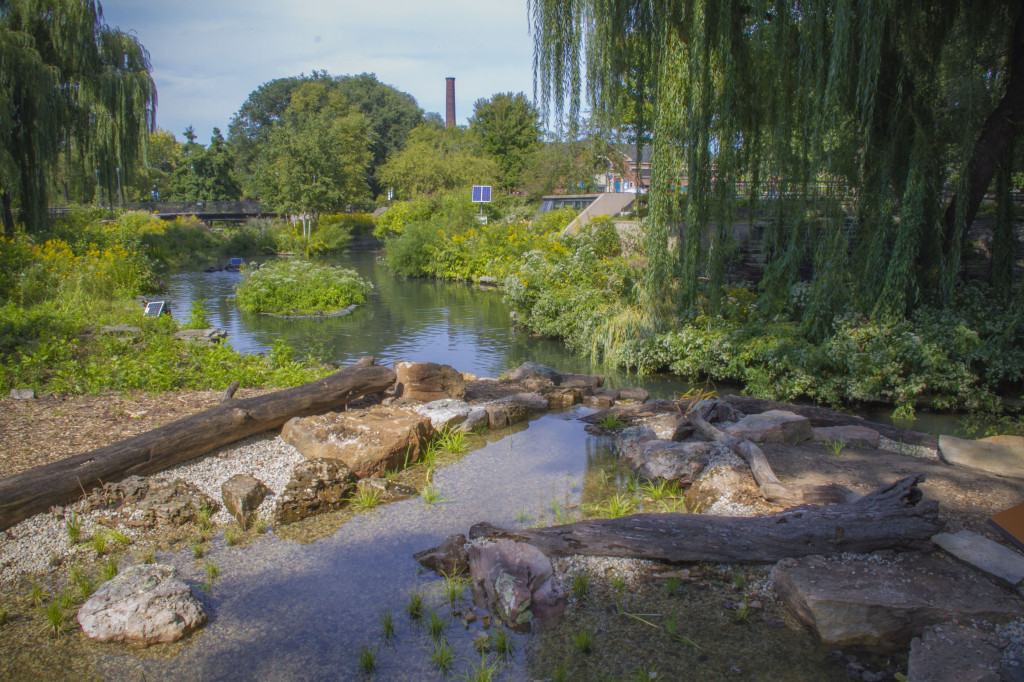
Above – A beautiful constructed wetland in action at the Lincoln Park Zoo in the USA.                             Source:http://www.acornponds.com/bog-filtration.html

What is a Constructed Wetland?

Constructed wetlands are engineered systems that use natural functions of vegetation, soil, and organisms to treat different water streams. Depending on the type of wastewater that has to be treated the system has to be adjusted accordingly which means that pre- or post-treatments might be necessary.

Constructed wetlands can be designed to emulate the features of natural wetlands, such as acting as biological-filters or removing sediments and pollutants such as heavy metals from the water. Constructed wetlands sometimes serve as a habitat for native and migratory wildlife, although that is usually not their main purpose.

There are three main types of Constructed Wetland:

  • Subsurface flow constructed wetland – this wetland can be either with vertical flow (the effluent moves vertically, from the planted layer down through the substrate and out) or with horizontal flow (the effluent moves horizontally, parallel to the surface)
  • Surface flow constructed wetland
  • Floating treatment wetland


Cost of Constructed Wetlands

Constructed wetlands are self-sustaining, and thus their lifetime costs are significantly lower than those of conventional treatment systems. Often their capital costs are also lower compared to conventional treatment systems. They do take up significant space, and are therefore not preferred where real estate costs are high. Overall, constructed wetlands are generally significantly cheaper than conventional treatment systems.

How do they Work?

A constructed wetland is an engineered sequence of water bodies designed to filter and treat waterborne pollutants found in sewage, industrial effluent or storm water runoff. Constructed wetlands are used for wastewater treatment or for greywater treatment, and can be incorporated into an ecological sanitation approach. They can be used after a septic tank for primary treatment, in order to separate the solids from the liquid effluent. Some CW designs however do not use upfront primary treatment.

Vegetation in a wetland provides a substrate (roots, stems, and leaves) upon which microorganisms can grow as they break down organic materials. This community of microorganisms is known as the periphyton. The periphyton and natural chemical processes are responsible for approximately 90 percent of pollutant removal and waste breakdown. The plants remove about seven to ten percent of pollutants, and act as a carbon source for the microbes when they decay. Different species of aquatic plants have different rates of heavy metal uptake, a consideration for plant selection in a constructed wetland used for water treatment. Constructed wetlands are of two basic types: subsurface flow and surface flow wetlands.

tilley_et_al_2014_schematic_of_the_vertical_flow_constructed_wetland

Above is an example Horizontal Subsurface Flow Constructed Wetland. Source: https://en.wikipedia.org/wiki/File:Tilley_et_al_2014_Schematic_of_the_Horizontal_Subsurface_Flow_Constructed_Wetland.jpg

tilley_et_al_2014_schematic_of_the_vertical_flow_constructed_wetland-1

Above is an example of a Verticale Subsurface Flow Constructed Wetland. Source: https://en.wikipedia.org/wiki/Constructed_wetland#/media/File:Tilley_et_al_2014_Schematic_of_the_Vertical_Flow_Constructed_Wetland.jpg

How well does this connect to this weeks reading?

The concept of Constructed Wetlands connects very well to our reading. The following are some key connections:

  • An excellent use of innovative technologies.
  • Provides a long term water management plan.
  • Address both wastewater and stormwater concerns.
  • A great example of the ecosystem approach – not only are constructed wetlands providing an ecosystem service to the human population (waste control), but they also create additional oxygen producing plants and provide a habitat for local birds and wildlife.

References:

Canada Mortgage and Hoursing Corporation – “Constructed Wetlands”                                           https://www.cmhc-schl.gc.ca/en/inpr/su/waho/waho_008.cfm

USA Environmental Protection Agency – “Constructed Wetlands”                                                     https://www.epa.gov/wetlands/constructed-wetland

Water Canada – “Constructed Wetlands: How Cold Can You Go?”                                                     http://watercanada.net/2009/constructed-wetlands/

School of Environment Sciences, University of Guelph – “Constructed Wetlands” http://www.ces.uoguelph.ca/water/NCR/ConstructedWetlands.pdf

Spam prevention powered by Akismet