Energy and Water Nexus: a complex interdependent system.

When thinking of saving water, the first thought that comes to mind is to take a quick shower or to close the tap when brushing the teeth. But, have you ever thought that you could save water by turning off the lights?

Water and energy are highly interconnected and interdependent systems. Water is used in almost all phases of the energy chain, for both fuel and electricity production, and energy is necessary to provide water extraction, treatment, transport and heating or cooling. It is estimated that the energy sector is responsible for 10% of all global withdrawals and water services counts for 4% of the global electricity consumption (EIA, 2016).

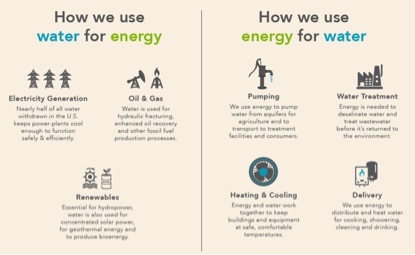
Figure 1. Water and Energy Nexus (US Energy Department, 2014a).


Water for Energy

Water is required for fuel production and processing, including fossil, nuclear and biofuel, as well as electricity generation such as thermoelectric, hydropower, nuclear and renewable technologies. Water usage for energy production can be expressed as water withdrawals or consumption. Water consumption is the water that is evaporated, transpired or incorporated into crops’ biomass on biofuel production, being removed from the immediate environment. Water withdraw is the volume of water extracted and returned to the water source, sometimes in lower quality, to be used again by other consumers or by the natural environment (U.S. Department of Energy, 2014).

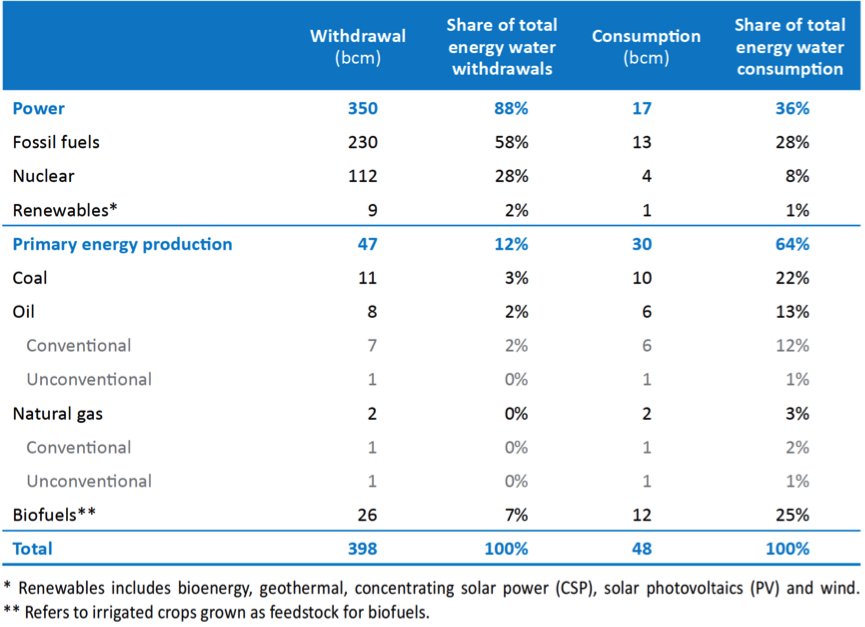
Table 1 below presents the global water withdrawals and consumption by energy sector. Power generation is responsible for the largest water withdrawals (88%), while primary energy production is the largest consumer (64%). Cooling processes of thermoelectric plants (fossil fuels power stations) are the major contributors for both withdrawals and consumption, in which once-through cooling systems require large withdrawals but less consumption and the recirculating systems consume more water by evaporation and require less quantity of water. The second largest consumer and the third major contributor for water withdrawals is the biofuel production. Water is withdrawn for irrigation and is consumed by evapotranspiration processes, being incorporated into the crops. Although biofuels are considered renewable sources, it represents a huge impact on water usage. This aspect needs to be evaluated when planning the energy matrix of a country (IEA, 2016).

Table 1. Water withdrawals and consumption for energy production, 2014 (IEA, 2016).

In 2013, approximately 60% of Canadian water bodies withdrawals, 38 million cubic metres of water, were used to thermal power generation (Environment and Climate Change Canada, 2016). Although the country has a huge hydroelectric park, thermals still represent 20% of the Canadian power generation source, particularly on the colder regions of Saskatchewan, Nunavut, Northwest Territories, Alberta and Nova Scotia (Natural Resources Canada, 2016). Improving the efficiency of these plants represents a great opportunity to save water in Canada.


Energy for Water

The energy required for each step of water systems relies on site-specific conditions including topography, distance from the water source to the customers, quality of raw water, level of treatment required, losses and inefficiencies. Pumping is the most energy intense step and is involved in most of the processes, from extracting to distribution, including treatment.

Figure 2 shows the amount of energy per cubic meter required by some water processes, and the global energy consumption in the water sector. In 2014, a total of 820 terawatt-hours (4% of the global electricity consumption) were used for water and wastewater services (EIA, 2016).

Desalinization and wastewater treatment are the highest-intensity energy users, but they do not currently represent the largest consumers. However, considering population growth and climate change predictions leading to lower surface and groundwater availability, wastewater reuse and desalinization techniques tend to become more widely used worldwide, leading to an increase in the total global energy required for water supply.

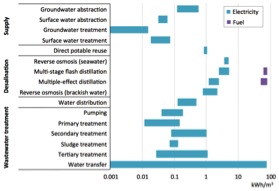
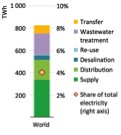
Figure 2. Energy required by water processes per cubic meter (left) and global energy consumption in the water sector (right) (EIA, 2016).

The more the water is treated and the further transported, more energy intensity it becomes, and more water is consumed to provide this energy. Although water and energy resources are interconnected, they are usually managed separately. Considering though a scenario of scarcity, this paradigm needs to change.


Planning together, the US example

Future infrastructure development requires strategies that optimize natural resources consumption, adopting a systems thinking approach and integrating teams and plans. Recently, some countries such as the US have been making progress in this area.

In 2012, after a drought that limited water availability and constrained the operation of some power plants, the US Energy Department created the Energy-Water Nexus Crosscut Team. The group’s actions include developing research and technologies; sharing datasets; integrating models to inform decision-making; harmonizing policies; and enhancing public dialogue to improve water and energy usage. In 2014, was published the report The Water-Energy Nexus: Challenges and Opportunities, defining the following six strategic pillars to address the water-energy nexus (U.S. Department of Energy, 2014):

1. Optimize the freshwater efficiency of energy production, electricity generation, and end-use systems;

2. Optimize the energy efficiency of water management, treatment, distribution, and end-use systems;

3. Enhance the reliability and resilience of energy and water systems;

4. Increase safe and productive use of non-traditional water sources;

5. Promote responsible energy operations with respect to water quality, ecosystem, and seismic impacts and

6. Exploit productive synergies among water and energy systems.

Based on these pillars, a range of actions has been set, since costly initiatives as the development of new technologies and robust computational models, to simple measures such as to reduce waste, which can represent a huge economy. According to the USEPA (2018), municipalities can save from 15% to 30% of the water and wastewater plants operating costs by incorporating energy efficiency practices. It includes planning intermittent processes to run during off-peak hours, installing soft starters to reduce energy used by pumps or even turning off the lights. Similarly, energy systems can reduce water withdrawals by reducing leaks and improving cooling systems through the implementation of closing loops and heat recovery.

The US case represents an example of a strategy to optimize water and energy systems’ efficiency. Their initiatives may become a role model for other countries to face the challenges of managing water and energy in a scenario of scarcity.


References

Environment and Climate Change Canada, 2016, Canadian Environmental Sustainability Indicators: Water Withdrawal and Consumption by Sector. Consulted on day Month, year. [online]. Available at:

www.ec.gc.ca/indicateurs-indicators/default.asp?lang=en&n=5736C951-1 [Accessed on November 30, 2018].


EPA, 2018, Energy Efficiency for Water Utilities. [online]. Available at:

https://www.epa.gov/sustainable-water-infrastructure/energy-efficiency-water-utilities [Accessed on November 30, 2018].


IEA, 2016, World Energy Outlook 2016: Water-Energy Nexus. [online]. Available at:

https://www.iea.org/publications/freepublications/publication/WorldEnergyOutlook2016ExcerptWaterEnergyNexus.pdf [Accessed on November 30, 2018].


Natural Resources Canada, 2016, Electricity facts. [online]. Available at:

https://www.nrcan.gc.ca/energy/facts/electricity/20068 [Accessed on November, 29, 2018].


U.S. Department of Energy, 2014, The Water-Energy Nexus: Challenges and Opportunities; U.S. DOE: Washington, DC. [online]. Available at:

https://www.energy.gov/downloads/water-energy-nexus-challenges-and-opportunities [Accessed on November 30, 2018].


US Energy Department, 2014a, Ensuring the Resiliency of Our Future Water and Energy Systems. [online]. Available at:

https://www.energy.gov/articles/ensuring-resiliency-our-future-water-and-energy-systems [Accessed on November 29, 2018].


The world’s Largest Waste to Energy Plant.

Largest Waste-To-Energy Plant in the world.

Waste to Energy Plant

The waste-to-energy plant is a waste management facility that combusts waste to produce electricity. They form an essential part of a sustainable waste management chain. Generates valuable and sustainable electricity and heat, of which 50% is recognized as renewable, and the other 50% is derived from recovered energy sources that would be lost otherwise. It also helps in reducing the carbon footprint of human activities through reduced methane emissions from landfill, it offsets the use of fossil fuels for energy production and the recovery of materials.

hence it provides a meaningful outcome for wastes. Some of the benefits of this plant are:

  • Fully complementary to recycling by recovering energy from unrecyclable waste.
  • Recovers significant amounts of ferrous and non-ferrous metals.
  • Removes toxic substances from the eco-cycle.
  • Allows up to 95% landfill diversion rate.

Waste Management in China

China is the world’s largest Solid waste generator, producing as much as 175 million tons of waste every year. For a developing country like china it is not easy to manage its entire waste and convert it into energy. There exist many challenges such as insufficient or elusive data, poor infrastructure, informal waste collection systems, the lack of laws and regulations, lack of economic incentives and the high costs associated with biomass technologies. Hence china should focus on its policy reformation to eliminate the unsustainable management of waste and underutilization of its potential energy which can only be possible by adopting integrated solid waste management strategies. Nevertheless, China has started to realize the importance of  IWMS and with help of the government they have been working towards building the world’s largest waste to energy plant in the country.

Sustainable energy

With continuous economic growth in China and throughout Asia, there is a growing demand for reliable, sustainable and clean renewable energy. To help meet this demand, China has planned to build the largest Waste to the Energy treatment plant in the world in Shenzhen East. For this plant, B&W Vølund will supply equipment that includes a DynaGrate combustion grate system, hydraulics, burners, and other boiler components.  The plant is expected to be an important showcase of the most advanced technology for environmentally friendly energy production in China. The plant is designed by Schmidt Hammer Lassen Architects and Gottlieb Paludan Architects will take a distinctive circular form, so as to minimize the plant’s footprint and reduce the amount of excavation required during construction. Built with sustainability in mind, it will incorporate rooftop solar panels, a visitor education center and an observation platform into its architectural design. When operational, it will incinerate about 5600 tons of trash per day out of 15,000 tons to generate 550 million kWh of electricity every year. It will also generate renewable energy using 44,000 m2 of solar panels incorporated on the rooftop and It will be the first plant in China to use B&W Vølund’s DynaGrate technology.

DynaGrate technology

Unlike other types of grates, there is no physical contact between moving grate components. This unique design limits wear and minimize the mechanical forces internally in the grate. The mechanical design of the DynaGrate system is developed to increase plant availability and lower operation and maintenance costs. With this grate, plant operation is not interrupted by melting metals. The mechanical break-up of the waste layer on the grate results in thorough agitation and thereby superior combustion conditions resulting in very low total organic carbon (TOC) values in the bottom ash. Also, it is designed to minimize the maintenance cost.

References

Fernandez, M. (2018, August 3). Retrieved from BioEnergy Consult: https://www.bioenergyconsult.com/waste-to-energy-china/

Schmidt Hammer Lassen. (2016). Retrieved from SHL website: http://www.shl.dk/shenzhen-east-waste-to-energy-plant/

Zhang, D. l. (2015). Waste-to-Energy in China: Key Challenges and Opportunities. Energies, 14182-14196.


Adapting to Climate Change: Flexibility in Resilient Cities

With pressures of climate change becoming a major global issue, the idea of resilient cities has become somewhat of a buzzword. I would like to focus on one overarching theme in resilient city literature and solutions: flexibility. 100 Resilient Cities defines urban resilience as “the capacity of individuals, communities, institutions, businesses, and systems within a city to survive, adapt, and grow no matter what kinds of chronic stresses and acute shocks they experience.” This is achieved “By strengthening the underlying fabric of a city and better understanding the potential shocks and stresses it may face.”

Change is inevitable, so our cities must be able to absorb impacts, react and adapt accordingly. However, infrastructure is usually something seen as permanent and lasting (de Haan). In mechanics, one learns that brittle fracture is much more dangerous than ductile fracture. It acts as a warning of the damage to come, and can absorb more energy prior to fracture, resulting in a stronger and more resilient structure. Why not apply this at a city scale?

In general, flexibility means the possibility to introduce certain options with the assumption of changing configuration of system parameters or system components in time (Kośmieja and Pasławski). De Haan points out that “the complexity of, especially nowadays, infrastructure systems suggests that we step away from attempts to control circumstances and prepare for their consequences.” My interpretation of flexible infrastructure lies in understanding that there are different possible outcomes and acknowledging that cites (and environments) change.

Flexibility can come in different scales. For example, buildings can be designed to be more seismically sound by including literal flexible materials within them, such as timber. This can be seen in Tūranga, the new central library in Christchurch, New Zealand, designed by Schmidt Hammer Lassen of Denmark. The building includes a “seismic force-resisting system [that] is made up of a series of massive concrete walls that can rock and shift to isolate the building from peak accelerations during an earthquake.” Along with the use of pre-tensioned steel cables that stretch and flex, allowing the building to right-itself in the event of swaying, this structure is virtually earthquake-proof.

At a larger scale, the Østerbro neighbourhood of Copenhagen is a resilient neighbourhood that incorporates flexibility in rainfall systems. Due to climate change, Copenhagen has dealt with increasing levels of high-intensity rainfall that original systems could not cope with. In the creating of resilient infrastructure, these increased rainwater levels were seen as an opportunity, rather than an issue that needed to be removed. As the old rainwater management systems could not be changed (an example of the rigidity of non-resilient infrastructure), and due to minimal space restrictions, new innovations needed to be implemented locally and in tandem with increases in public green spaces. For example, in Tåsinge Plads, a square in the community, rainwater is diverted away from roofs and squares to keep the water out of sewers, while the storm water is collected in green urban areas to support the incorporation of wild urban nature in the community. In the few paved areas, ‘water parasols’ were created for children as play elements, that double as catchment basins that pump water through small channels to green spots (these are the inverted umbrella-like black structures in the image below). Here, it is important to see that flexibility is not just physical, it is a mindset – and one must bring a systems thinking approach to planning for flexibility.

One of my favourite examples of resilient infrastructure can be seen in Rotterdam. Similar water issues are being dealt with here, where water squares have been created to act as social spaces, but in the event of flooding, can also hold excess water. The flexibility in this site is clear, with multiple functions that addresses urban social living along with sustainable solutions simply, without the need for any advanced technical solutions or materials.

Urban resiliency is a buzzword for a reason: it is vital that cities address issues of our changing environments immediately, as well as do what is possible to prevent further global environmental degradation. A key component to this change is to introduce flexibility in approaching problems and at different scales. The Anthropocene is upon us, human activity is indeed the strongest geo-technical force at this moment, but why not try and make this impact a positive one?

OTHER RESOURCES

Maria Kośmieja, Jerzy Pasławski – https://doi.org/10.1016/j.proeng.2015.10.013

de Haan – https://doi.org/10.1016/j.futures.2011.06.001

http://www.rotterdamclimateinitiative.nl/documents/2015- enouder/Documenten/20121210_RAS_EN_lr_versie_4.pdf

https://www.sciencedirect.com/science/article/pii/S0016328711001352

https://link.springer.com/content/pdf/10.1007%2F978-3-319-49730-3.pdf

https://www.curbed.com/2018/5/11/17346550/organic-architecture-infrastructure-green-design

https://www.worldbank.org/en/results/2017/12/01/resilient-cities

https://openknowledge.worldbank.org/handle/10986/11986

https://www.resilientcity.org/index.cfm?id=11900

https://www.iiste.org/Journals/index.php/CER/article/viewFile/38207/39282

http://www.100resilientcities.org/resources/

Healthy Environments in The Netherlands

Posted by Michael Veerman, February 1, 2018

During the summer of 2017, I was part of a Sustainable Community Systems: Netherlands program. The program focused on the principles, practice, and policy for sustainable planning and design of land use and transportation systems, with Canadian and international perspectives.

Within the first week of being exposed to the country, it became clear that Dutch urban infrastructure holds an abundance of sustainability design features. The video below outlines the country’s outstanding achievements in the following categories and how it compares to Vancouver and other places.

  1. Abundance of Public Transportation Services
  2. Protected Bicycle Path Infrastructure
  3. Bicycle Parking Infrastructure
  4. Public Spaces
  5. Green Spaces
  6. Noise Reduction
  7. Renewable Energy Infrastructure
  8. Government Leadership

Haze and District Energy System in Beijing


Haze is one of the disaster weathers. Beijing one of the largest city in the world is facing this whether for more than 150 days per year. The rapid growth of social economy increases energy demand, which challenges the energy production within the city. Persistent haze occurs and the number of days for haze is increasing dramatically.


The cause of haze is complex. One of the cause is the use of coal to produce energy for heating in the building. China is rich in coal. However, colas are not environment-friendly fuels. The solid and gas waste produced by burning coals cause serious environmental problems. To reduce the air pollution, city of Beijing use district energy systems.


The district system in Beijing is divided into more than 16 different energy-producing stations. Each station covers a certain amount of area and produces hot gas to warm the building in that area. In each energy station, natural gas and high-quality coal are used to produce “clean heat”. The high efficiency of district energy system in Beijing result in reduce GHG emissions and improve air quality. According to a research, the CO2 emission in Beijing reduced by 502 ton in 2010(natural gas replace coal for energy use,2015)

The energy use and GHG gas emissions have improved a lot in past decade. The use of district energy system greatly reduces the air pollution in Beijing. However, there is still a long way to go in China to improve the use of energy. Education individuals to use energy in more efficient ways can be helpful. Some other new technologies can also be applied to produce a clean and renewable energy system.


References

Conservation and Supply of Buildings. (2017). Retrieved November 21, 2017, from https://connect.ubc.ca/bbcswebdav/pid-4457089-dt-content-rid-22874392_1/courses/SIS.UBC.CIVL.498A.101.2017W1.87579/Week%2004%20Material/CIVL498_Video4_Script-Urban%20Energy%20Systems-Conservation_and_Supply_in_Green_Buildings.pdf


Zhang, X. (2015). Natural gas replace coal for energy use. Retrieved November 21, 2017, from http://download.people.com.cn/csw-zk-20160108-1.pdf

IDP: Use of Virtual Reality

The term virtual reality (VR) can be interpreted in different ways depending on the context. In the building industry it is most commonly used for computer mediated systems, environments, and experiences. In other words it is used to create 3D models of projects that are supposed to aid the design process. VR tools are still Very rarely used in practice, despite the fact that many benefits have already been identified.

Advantages

The combination of VR tools and VR immersive display systems can bring real value to the design review, the communication of the design intent, and it can increase the meeting efficiency. The use of this technology enables users to walk through a 3D model of a given project and by doing so helps to understand the aesthetics of the design because it gives the viewer a more direct feel of depth and volume of the space, which is more difficult by just looking at a static layout.

Furthermore meetings and discussions gain a new level of efficiency, because participants are more engaged and act more professional. The use of VR models brings external people up to speed to the current status easier and faster, leveling the expertise and familiarity with the design between different disciplines. This keeps participants more engaged in issues, that not necessarily regard their own discipline. This provides a holistic and diverse input, which then can spark deep questions and lead to unexpected discoveries, that otherwise might not have been detected until building turnover.

Challenges

This is not to say that VR tools do not pose difficulties or challenges. When using VR the appropriate level of detail has to be considered, as too many trivial issues might arose from a too detailed model. Similarly sometimes less is more when it comes to the modeled environment. Often intermediate designs are filled with placeholders, which will be redesigned in a later state of the process. Are those placeholders to detailed they might convey a wrong image of the design and could create a misinterpretation for those not familiar with the design process.

The preparation of  VR models requires a significant amount of preparation and coordination effort, a process that usually takes up several days. By the time the model is finished the design might have already changed.

Conclusion

To sum up, VR tools give opportunities to improve the design process by increasing meetings efficiency, and helping to keep all participants engaged, so that maybe even hidden issues can be identified. But at the same time very careful planning in preparing is necessary to avoid misinterpretations due to a unfit level of detail in the model. Today Virtual Reality is still underutilized, but one can hope that as the industry develops and becomes better defined the use those tools will increase and improve the design process.

Sources:

“Virtual Reality to Support the Integrated Design Process: A Retrofit case Study”
Yifan Liu, Jennifer Lather, John Messner, 2014

“I spy with my little eye… a District Energy System”

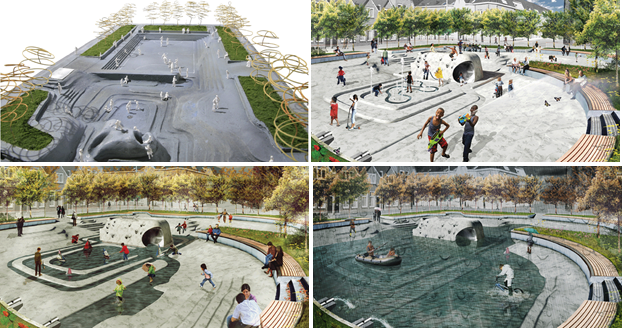
To many, these stacks are just part of a public art installation situated east of the Cambie Street bridge but if you look a little closer, you will see they are part of the Southeast False Creek Neighbourhood Energy Utility. The five stacks, which resemble a hand reaching up, are actually exhaust flues for the False Creek Energy Centre and the LED lights making up the ‘fingernails’ change colour according to the amount of district energy being produced by the system.
So why pair a public art display with a Neighbourhood Energy Utility? To help bring attention to a first-of-its-kind Neighbourhood Energy system in North America that captures waste heat from raw sewage to provide centralized space heating and hot water to the surrounding buildings in the Olympic Village neighbourhood. At the time of its construction, only three similar systems had been implemented in the world, two in Oslo, Norway and one in Tokyo, Japan. By recycling waste thermal energy, the system is reducing 60% of the pollution associated with heating and hot water use that would otherwise be produced by the neighbourhood’s buildings. Attention to the energy centre is also sought from passer-by’s by the large windows incorporated into the building allowing people to see the system in action.

The importance of Neighbourhood Energy systems is evident when you take a look at the numbers for energy consumption in Vancouver. Buildings, including residential, commercial, institutional and industrial, account for three quarters of the energy consumed by the city, which contributes to significant negative effects on the city’s carbon footprint. This also means that taking steps to reduce the non-renewable energy reliance of space heating and hot water, the two largest contributors to energy consumption in buildings, can have real and significant positive effects on the impact of buildings on the environment. The Southeast False Creek Neighbourhood Energy Utility falls in line with the third priority laid out in Vancouver’s Renewable Energy Strategy 2015-2050: expand existing and develop new neighbourhood renewable energy systems. Following suit, development of Neighbourhood Energy systems in South Downtown, Northeast False Creek, and in River District have been pursued. The City has also identified several other districts suitable for Neighbourhood Energy, all of which are large, high density areas or corridors with high development potential. These districts include downtown, central Broadway and the Cambie corridor.

The benefits of Neighbourhood Energy are clear but new technology still requires extensive educating and consultation for it to be widely supported by neighbourhood stakeholders. However, with increased public awareness of where our energy comes from, such as promoting learning through the use of public art, the hope is that more and more people will begin to realize that renewable energy sources exist right in our own backyard, or in this case, right in our own sewer system!

References

Project Website

Renewable City Strategy 2015-2050

Neighbourhood Energy in Vancouver – Strategic Approach and Guidelines

Image 1

Image 2

ENERGY EFFICIENCY AND SUSTAINABILITY IN INDIA


THE POTENTIAL FOR SUSTAINABLE POWER DEVELOPMENT IN INDIA

SOLAR

On average India is said to have around 300 sunny days in a year. The theoretical solar energy received by India’s land mass is around 5000 trillion kilowatt-hours per year. This value is greater than the combined energy from all of India’s fossil fuel energy reserves. As of September 2016, the country’s solar grid has a capacity of 8626 MW. In addition to large scale harvesting of solar energy, India has utilised smaller scale technologies that run on solar power. Kerosene lanterns are being replaced by solar powered lanterns in rural India.

In 2013, Cochin International Airport in South India started its ambitious project of going completely off the public electricity grid. Three years later it became the first fully solar powered airport in the world. The solar plant comprises of 46,150 solar panels laid across 45 acres of land. This plant is capable of generating 50,000 kilowatts of electricity daily.  There are plans underway to double the electricity production by 2017.

Most of the project was constructed in six months and the $ 10 million spent on it is projected to be recovered in the six years following construction. This solar power plant will produce energy equivalent to that produced by burning 3 metric tonnes of Coal (India’s most common source of electricity).

https://www.youtube.com/watch?v=pLAfpn09cco


WIND

Since 1986 when the first wind farms were set up in India, the country has progressed to become the 4th largest harvester of wind energy in the world. India’s estimated potential for wind farms is said to be around 2000 GW per year. Wind power accounts for close to 3% of India’s total power generation capacity. Around 70% of the wind energy is harvested during the 5 months of monsoon between May and September.

HYDROELECTRIC

The exploitable hydroelectric power potential is estimated at around 148000 MW per year. As of 2016, the harvested capacity was around 40000 MW which was 14.35% of total utility electricity generation in India. Most of the harvested hydro energy is from power plants in North and West India. The hydro power potential in Central India is largely unexploited due to opposition from the local population.

Sites with the potential to develop smaller scale hydro projects (less than 25 MW) exist throughout the country. Pumped storage units have allowed better energy balancing during peak hours and better coordination with solar power generation.

BIO FUEL

Jatropha curcas plant seeds are the main source of bio-fuel in India. The seeds of the plant are rich in oil and have been used as a source of bio-diesel by rural communities for several decades. Along with being a renewable and cleaner source of energy; bio fuel generation and usage helps strengthen India’s economy by reducing the nation’s dependence on foreign fossil fuels. Indian government has announced a policy of 20% blending of transportation fuels with bio fuels by 2017. Part of the inspiration to use more bio-fuels comes from the need to reduce the amount of air pollution in urban environments. Transportation vehicles are seen as the largest contributors to the deteriorating air quality in some of India’s largest cities.


GOVERNMENT POLICY MEASURES FOR ENERGY EFFICIENCY AND SUSTAINABILITY

UNNAT JYOTHI by Affordable LED’s for All (UJALA)

The UJALA programme promotes replacement of inefficient incandescent light bulbs with LED bulbs. Within the first year of this programme’s launch, 90 million LED bulbs were sold in the country reducing the electricity bills by US $820 million. The government’s target is to replace 770 million incandescent bulbs by 2019 with an annual estimated reduction of 20000 MW and savings of around US $5.9 billion in electricity bills alone.

JAWAHARLAL NEHERU NATIONAL SOLAR MISSION

JNNSM is an overarching goal to promote solar power generation. Some of the key components of this plan are:

  • Aggressive Research and Development into Solar Technology
  • Domestic production of Raw materials and components needed for solar power generation
  • Large scale goals for deployment of solar plants

Under this mission, capital costs of solar power station installation are subsidised. Subsidies are also offered for smaller scale solar technology implementation like PV water pumping systems for irrigation used in rural India.

STANDARDS AND LABELLING SCHEME

The S&L scheme is an attempt to curb the demand at the consumption level by enforcing certain standards for appliance manufacturers. All appliance manufacturers are required by law to label their products with a star rating system. Five stars for an appliance implies maximum efficiency for that product class. This system is intended to help consumers make more informed decisions on purchasing energy efficient appliances.

IDENTIFICATION OF SMALL HYDRO POWER SITES (LESS THAN 25 MW capacity)

This program is intended to encourage exploration and identification of small hydro power sites. Submission of a site plan and detailed project report on such sites will entitle the researching party for financial support of Rs. 6 lakhs for each project site identified below 1 MW; and Rs. 10 lakhs for each project identified over 1 MW. Various government agencies and local bodies are eligible to participate in this program.


 REFERENCES


In Detail: The Mosaic Centre

In south Edmonton, you can find Canada’s first net-zero commercial building. The Mosaic Centre is 30,000 square feet and it generates as much energy on site as it consumes in a year. Sustainable practices and technology are showcased in this structure. The project scope has included considerations such as incorporating geo-thermal technology, installing photovoltaic panels and using the framework of Low Impact Development as they marked its place in the public realm. In many ways, this construction project had implemented many of the strategies outlined in this weeks lesson. [Quick Statistics: The Mosaic Centre – Complete in 2015, 10.5 million dollar project, 3 months ahead of schedule and 5% under budget]

Construction Practices – Integrated Design Process.  The design team focused on a collaborative approach to execute this project. This is crucial to sustainable design. Intersecting systems can support and accentuate benefits of the technology, and reduce the likelihood that the systems clash with one another.

Energy Conservation and Energy Efficiency – To make such a large project come in Net-Zero, substantial amounts of work was put into making affordable, and energy efficient features throughout the building. This allows operations to continue within the building using less power. Both passive and mechanical systems are used to naturally light the space. Rather than feeding off the energy grid, this building produces the necessary energy to run on a daily basis. Since supply and demand of energy fluctuates throughout the year, excess energy produced on site is fed back into the utility grid (described as seasonal storage). This method of storage within the grid eliminates the need for battery banks. Those amounts of energy are fed back to the building when supply is low, but demand exists. This exchange between building and grid is incorporated into the net-zero analysis of the building.

Sustainable Power Supply and Renewable Energy Use – The generation of electricity can often time be very disruptive to the surrounding environment, and overall has a net output of carbon emissions. Carbon emissions from industry and commercial practices hugely contribute to these harmful emissions. The south west exterior wall and a portion of the roof have photovoltaic panels mounted for solar energy collection. This form of renewable energy was chosen after investigation of the multiple forms of renewable energy. Wind energy was not ideal, given the location, and thus solar energy became the single type used in this project.

Geo-thermal Heating and Cooling – Within the mechanical room, connections between external boreholes and the internal pipe system exist to make use of the geo-thermal system. The majority of the northern parking area is a geo-thermal field which helps to regulate the buildings temperature. In colder months, use of a high pressure glycol mixture allows access to available heat energy produced through the soil. Conversely, this same system serves to dissipate warm air during the hot months. Overall, the use of geo-thermal energy greatly decreased the number of solar modules needed for on-site electricity production.

Materials and Natural/Eco-Services – Wood was used as the primary building material for the Mosaic Centre. Wood features are presented well aesthetically and are exposed as architectural features to inspire future sustainable projects. Aside from the looks, use of wood sequesters carbon, reducing what would result in carbon emissions. Natural lighting and heat from the direct sunlight are also used to maintain a comfortable and well lit interior. Rainwater is collected on-site in a 25,000 litre storage tank. The water catchment design is not intended to fully cover the water demand, however it does supplement by contributing to the water supply. The main atrium also has a living wall,

Building Envelope –  High performance building design is used to optimize the intersecting systems within the building. A high quality building envelope allows air conditions to remain at the desired temperature. Other strategies, such as targeted shading and the reduction of interior structural loads, are in place to increase occupant comfort.

Education; Precedent Example and Presence in the Community – The structure itself is living proof that sustainable projects can be aesthetically pleasing, economically feasible, and socially conscious. Aims for certification (LEED Platinum and Certified Living Building) and recognition have also increased the visibility and credibility of this remarkable structure. It continues to contribute to environmental efforts while in service by the use of collaborative spaces built right into the structure. These spaces are used to hold and facilitate meetings for integrated teams working on projects with a sustainable focus. Its functionality, and accessibility in terms of transportation also point towards the buildings overall goal; to address sustainability in all design decisions. In analyzing and learning about this project, we can gain wisdom and momentum to initialize and effectively carry out the construction of net-zero commercial buildings.

Sources:
http://themosaiccentre.ca/how-we-did-it/
http://www.greenenergyfutures.ca/episode/first-net-zero-office-building

An Exploration of Germany’s Renewable Energy Revolution

Germany’s energiewende is an energy revolution that made them a leader in industrialized nations. As of today, 27% of Germany’s energy comes from renewable resources (more than twice that of the United States). They have pledge to reduce their carbon emissions by 40% by 2020, and 80% by 2050. This post explores the political, economical, and social situation that allowed such sweeping changes in the national energy system.

germany


Political

After the second world war, Germany was a divided nation. The German Green party came to power in 1980 amid nuclear power protests in West Germany and began bringing green ideology to the public’s attention. After Chernobyl exploded in 1986 one of Germany’s two major parties, the Social Democrats, joined the anti-nuclear cause. In 1998, these two parties formed a governing coalition. Two years later, a law was passed that guaranteed any renewable energy producer a price that more than covered costs, and the feed-in tariffs were guaranteed for 20 years. This provided the incentive needed for investors to start putting significant money into renewable energy.

Economical

Since the passing of the 2000 law, the tariff for a large new solar plant has fallen from 50 cents per kilowatt hour to just 10 cents per kilowatt hour. Over half of the investments in green energy have come from private citizens or local citizens associations. Further, no more of Germany’s gross domestic product is devoted to energy today than was in 1991. Instead, the money came from a surcharge on citizens electricity bills. The cost to the average user is about 18 euros a month, a not insignificant charge considering Germany already has the second-highest cost for electricity in all of Europe. However, despite these extra fees, the approval rating for energiewende from German citizens is an incredible 92%.

Social

Perhaps the most driving force for change in Germany’s energy production was the social climate. It began in the 1970’s, when serious harm to the nation’s forests from acid rain due to fossil fuel emissions caused widespread outrage. Germans place a high value on their undeveloped land, with their forests topping the list. Initially, the government proposed nuclear energy as a cleaner alternative energy source and it once produced a quarter of the country’s energy. However, when the disasters at Chernobyl and Fukushima struck, the citizens pushed back hard. In 1975, a nuclear power plant was proposed to the town of Freiburg, sparking almost of decade of protests and occupying of the site. Today, Freiburg is a completely solar powered city, producing more energy than it uses. Germany has currently shut down 9 of it’s 27 nuclear reactors, with plans to close the rest by 2020. 


Reference:

Kunzig, R. (2015, October 15). Germany Could Be a Model for How We’ll Get Power in the Future. National Geographic.

Spam prevention powered by Akismet