Crime in Vancouver
Summary
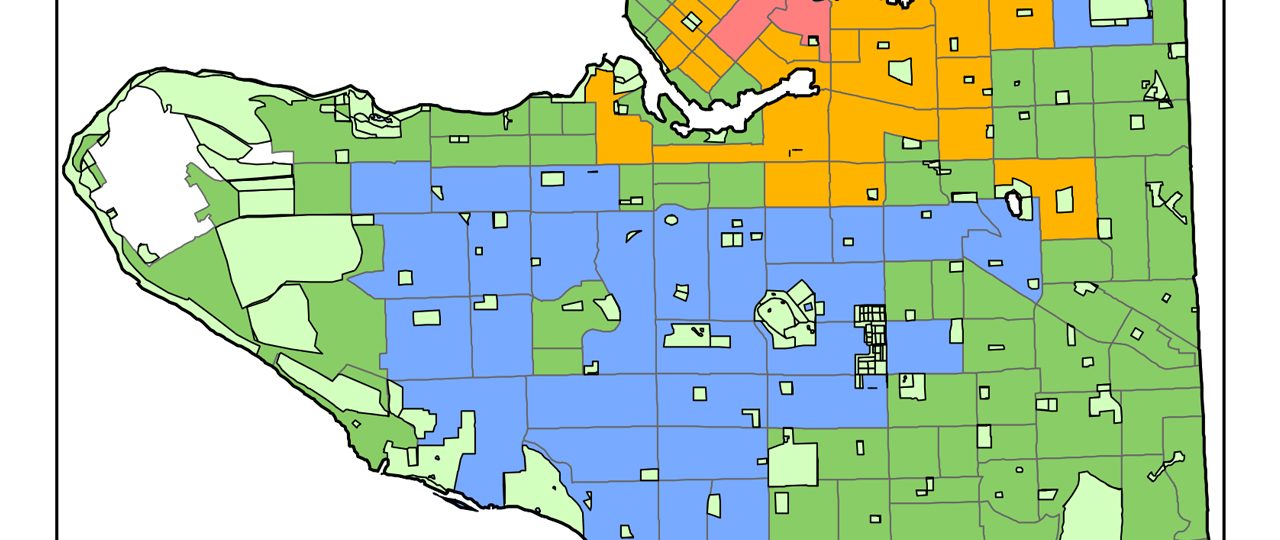
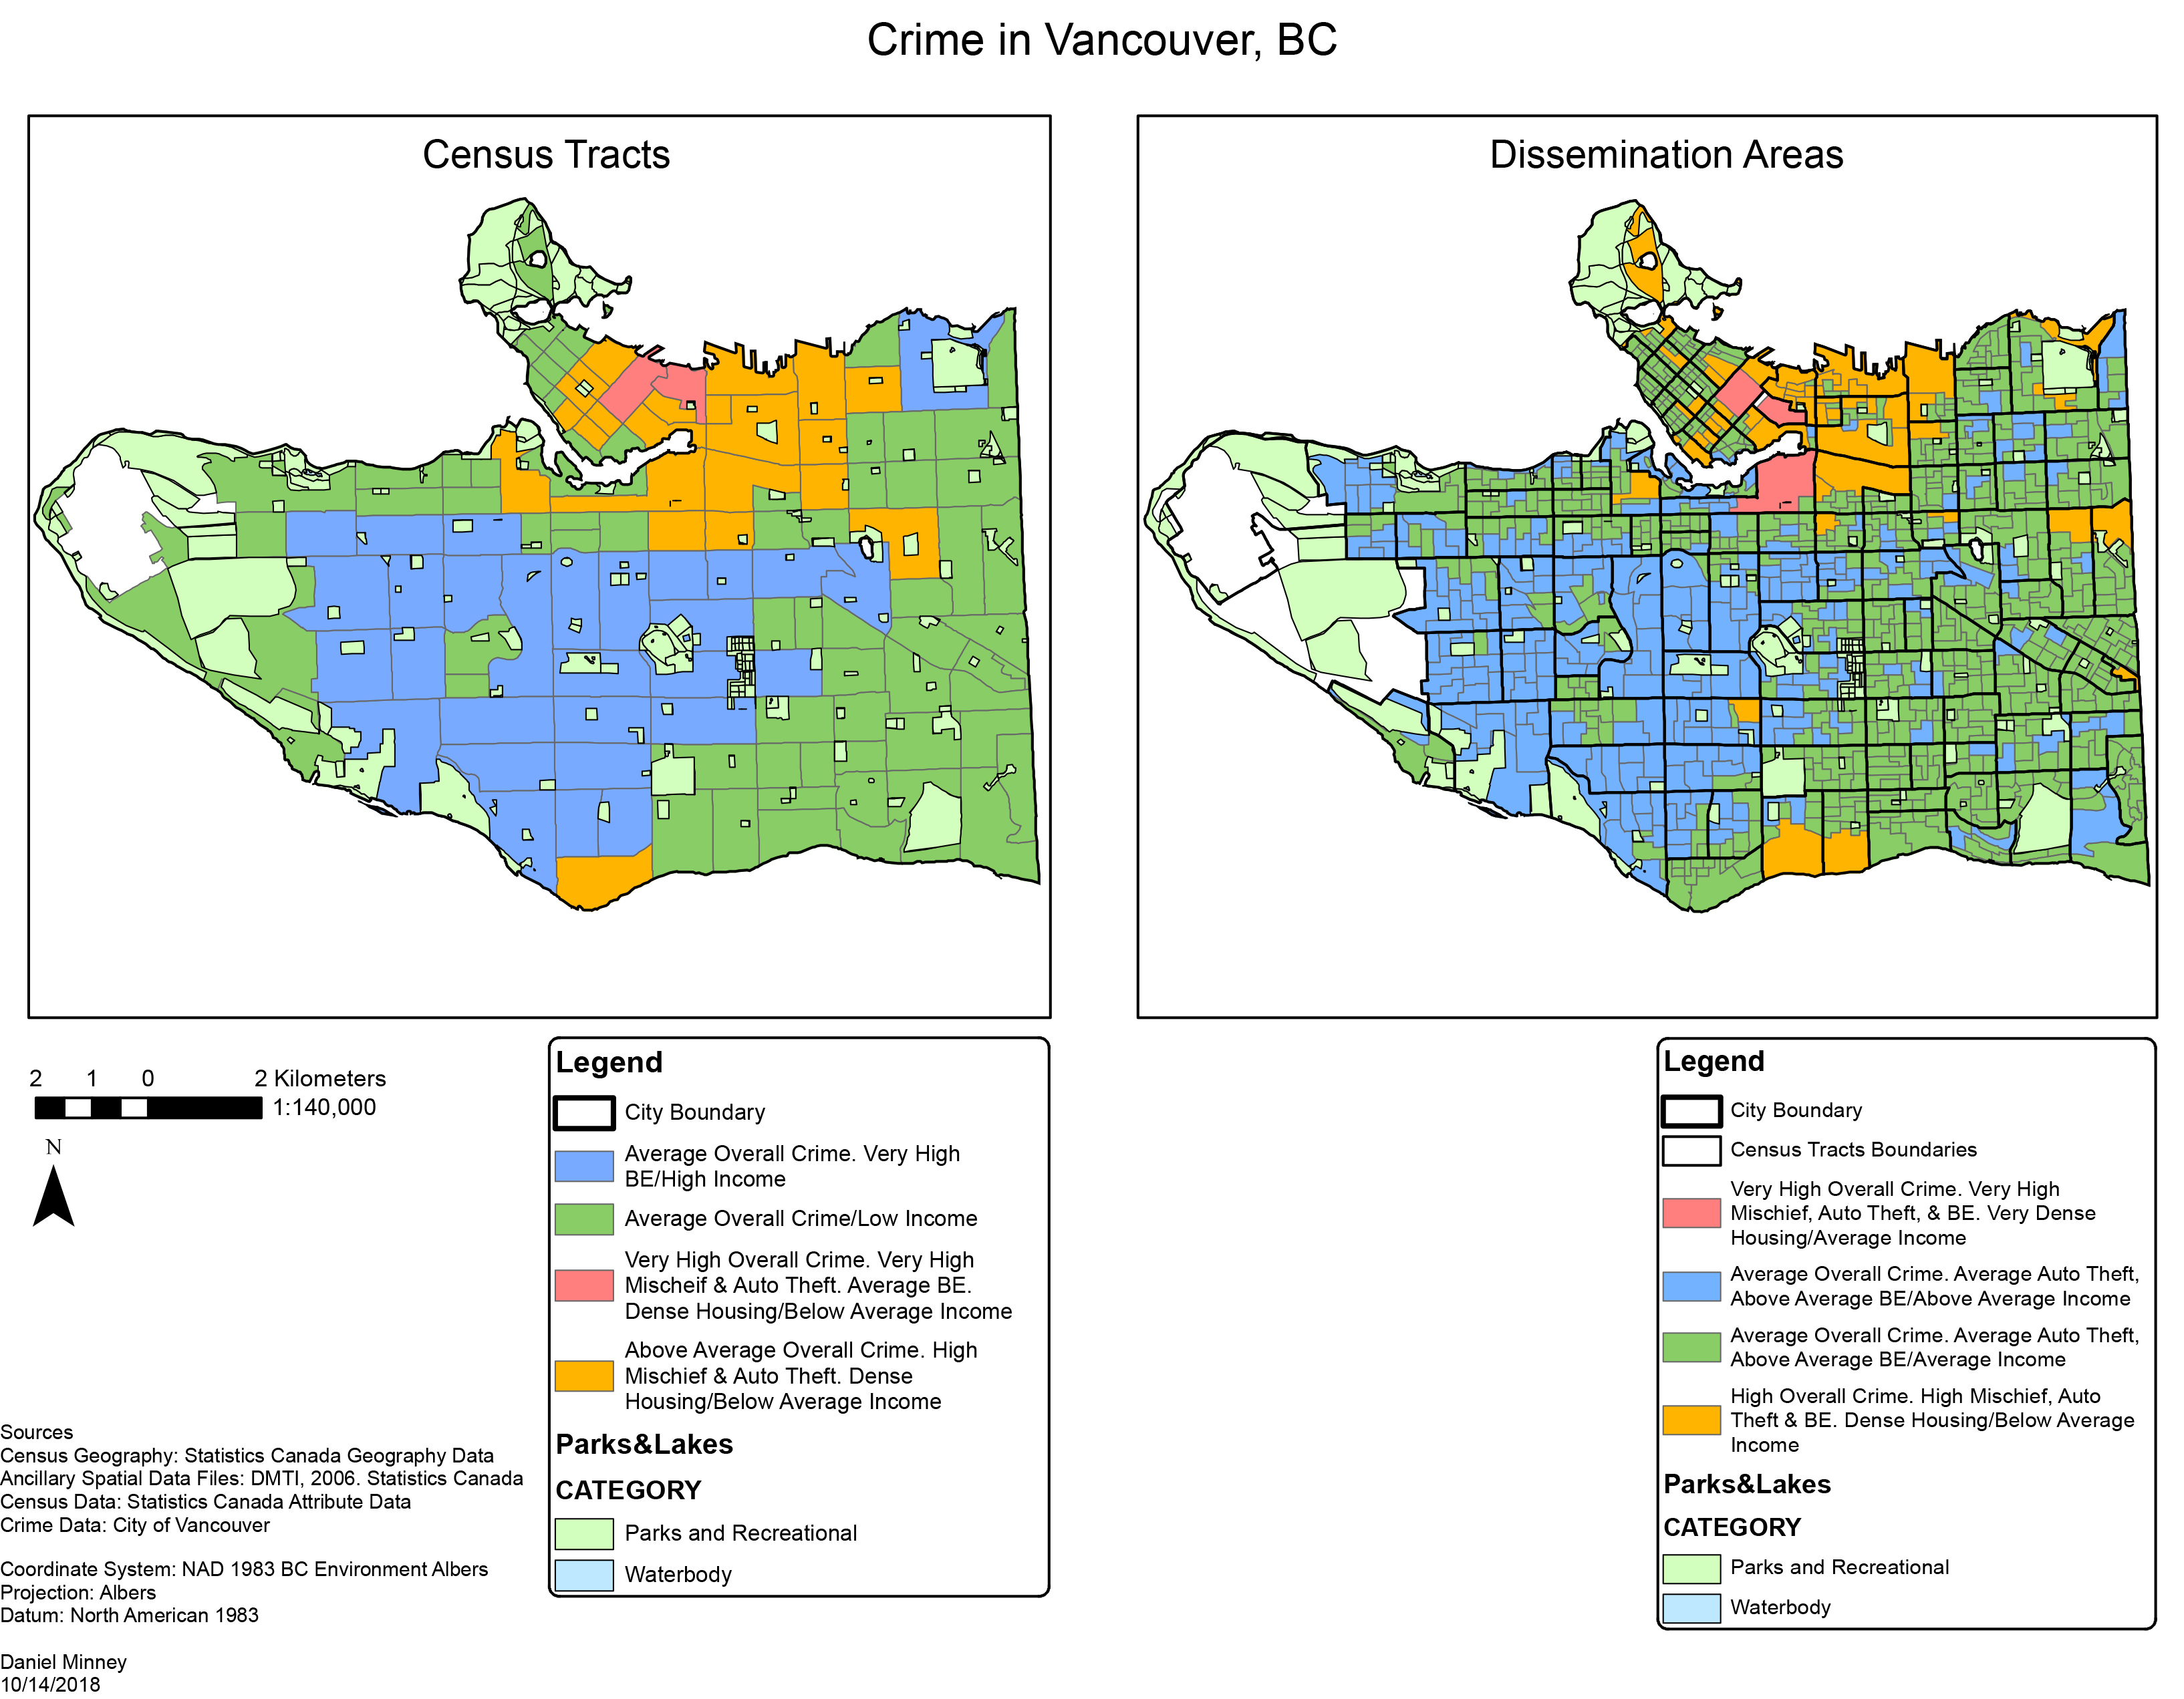
A crime map of Vancouver was created using both census tracts and dissemination areas. The classes were created from the box plots created using the Ordinary Least Squares (OLS) tool.
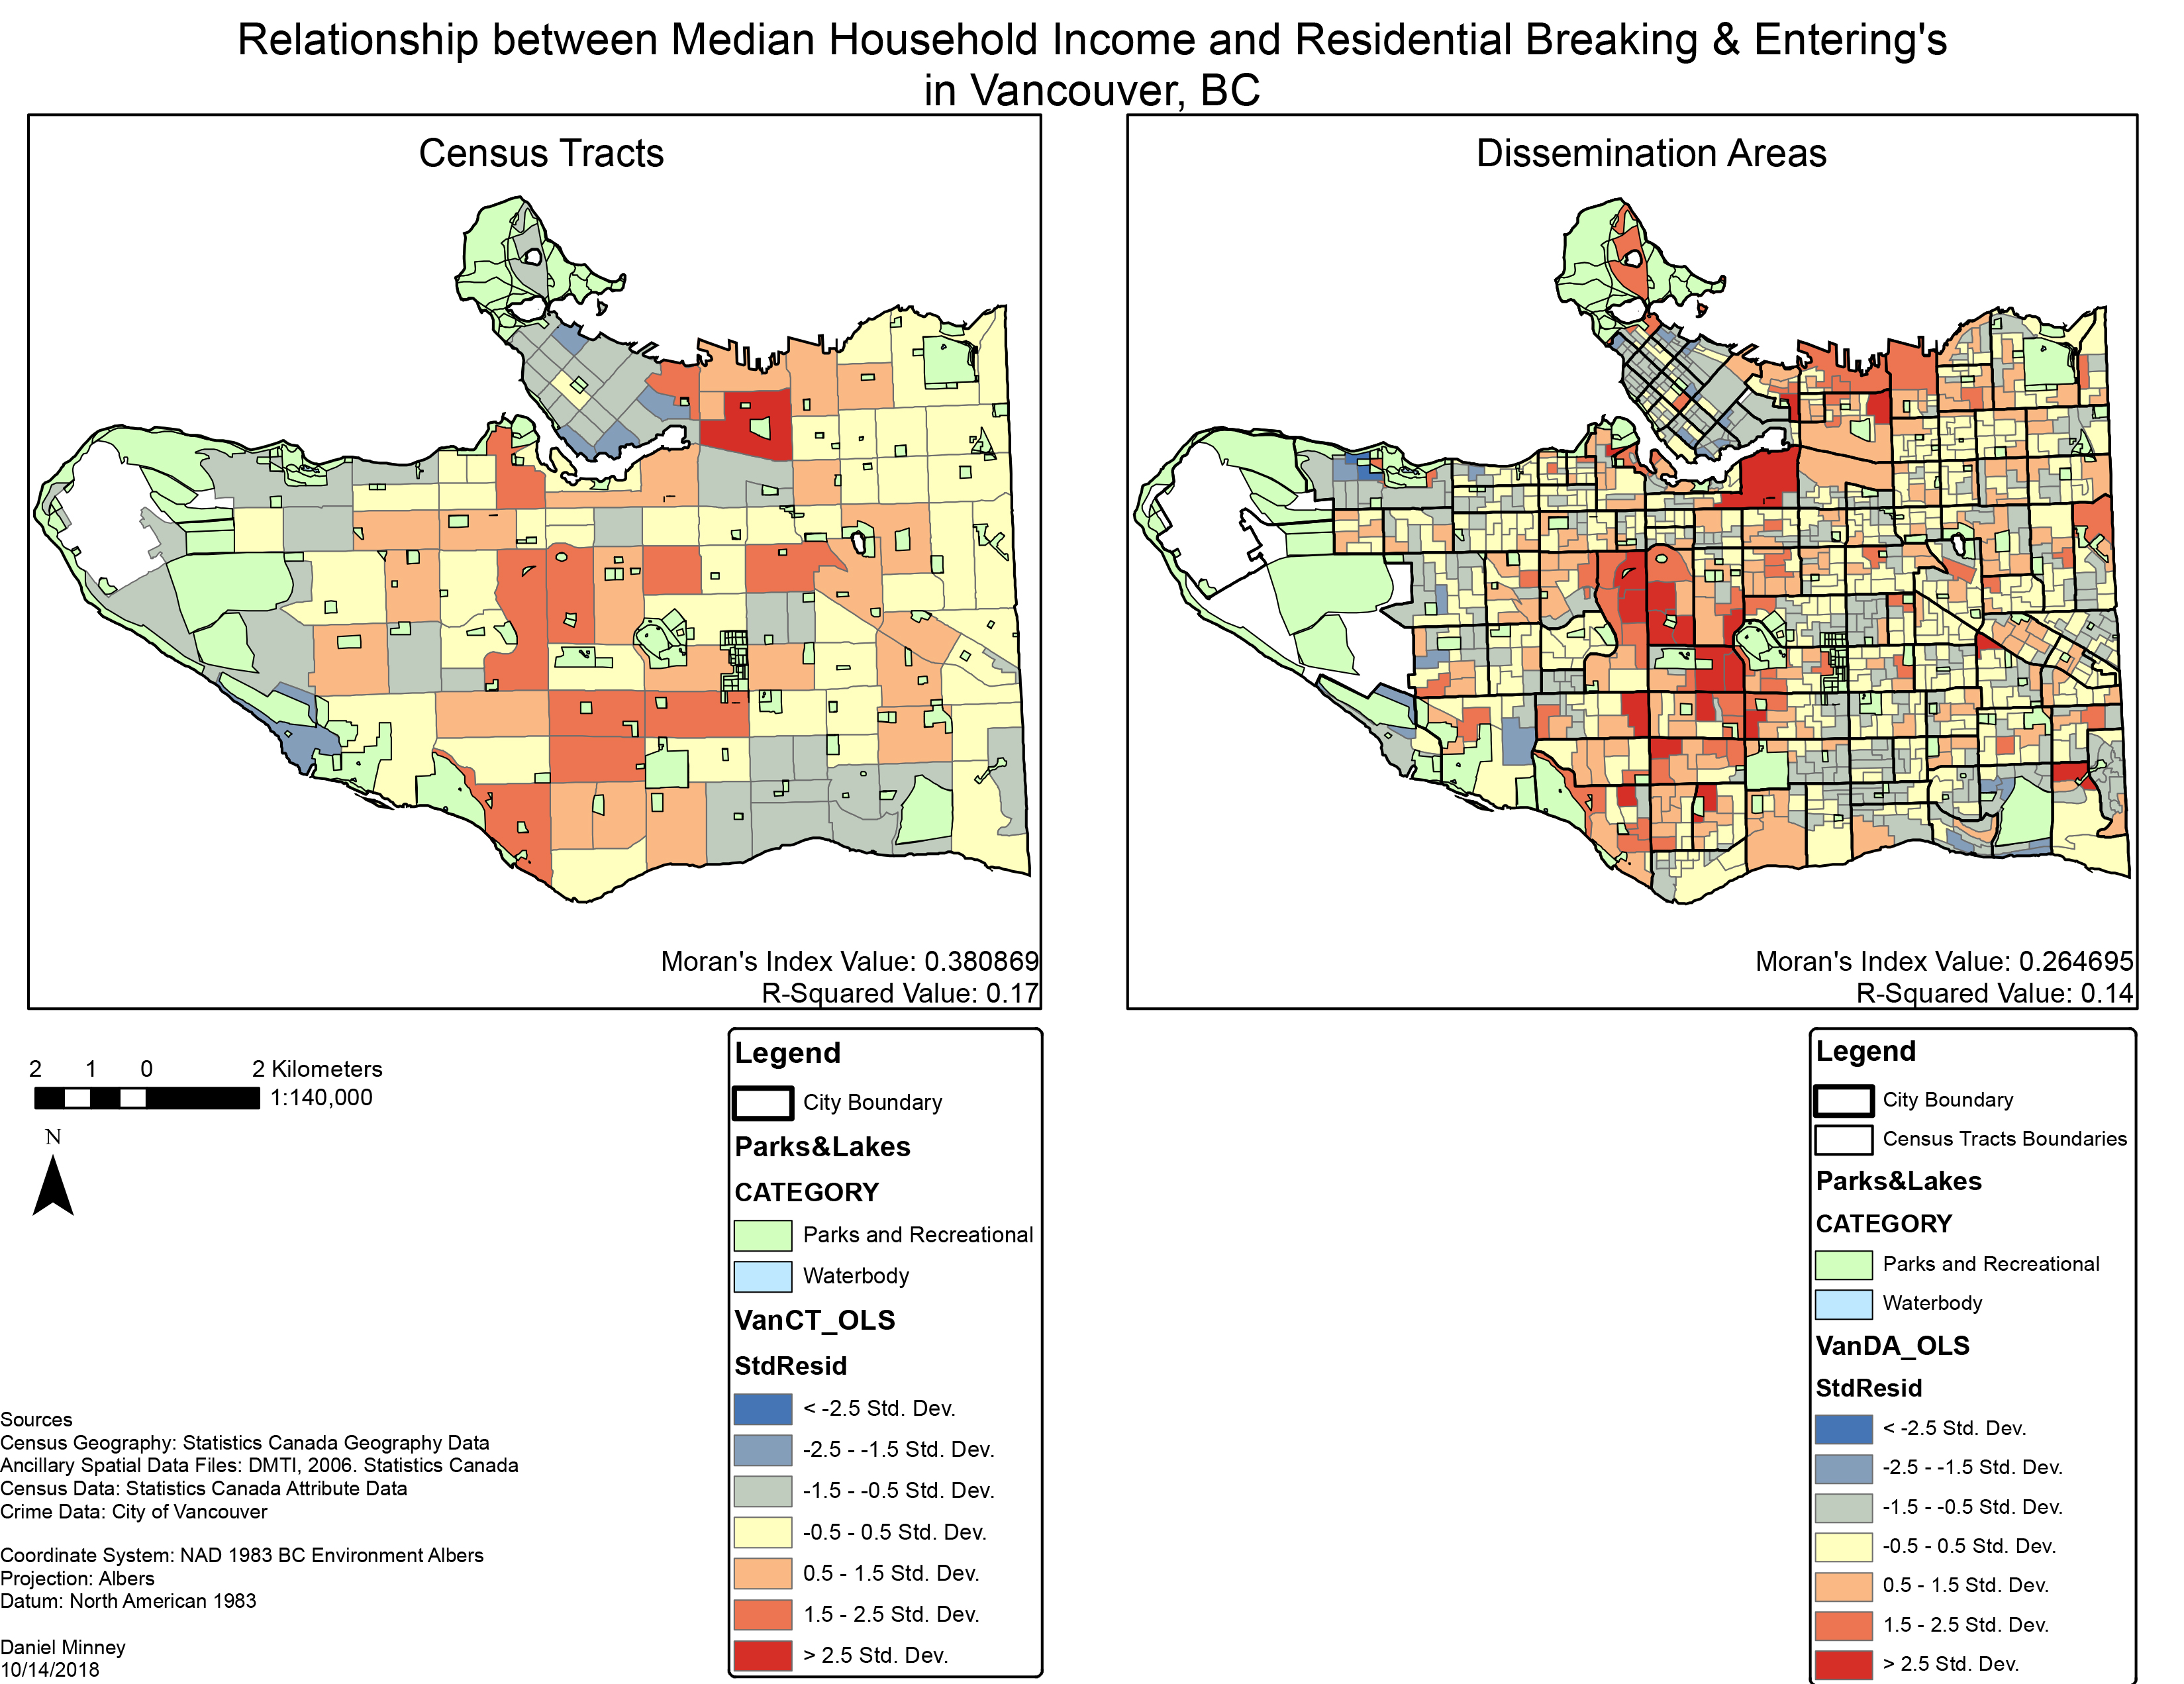
Within both maps, the Moran’s I values show us that the data has a positive spatial auto correlation, however, this correlation is not close to a value of 1, and therefore is strong. Both maps display somewhat similar patterns when it comes to the number of residential B & E’s relative to the median household income and the total number of households in Vancouver. However, the dissemination area map reveals small pockets that have a higher standard deviation. Additionally, the dissemination area map shows us that within each census tract, there is more variation than expected, making it hard to predict a correlation between higher median household income and the number of B & E’s. This is also seen through the R-squared values which show that only 14% of the data follows predicted values.
Scale has altered the results significantly. Visually, the Census Tract (CT) map seems to be much more spatially auto correlated than the Dissemination Area (DA) map.
Accomplishments
Gained an understand of Ordinary Least Squares, regression values, and spatial auto correlation, and how to visualize this on a map.