E-Portfolio | Daniel Minney

Web mapping with MapBox

Posted by in Cartography

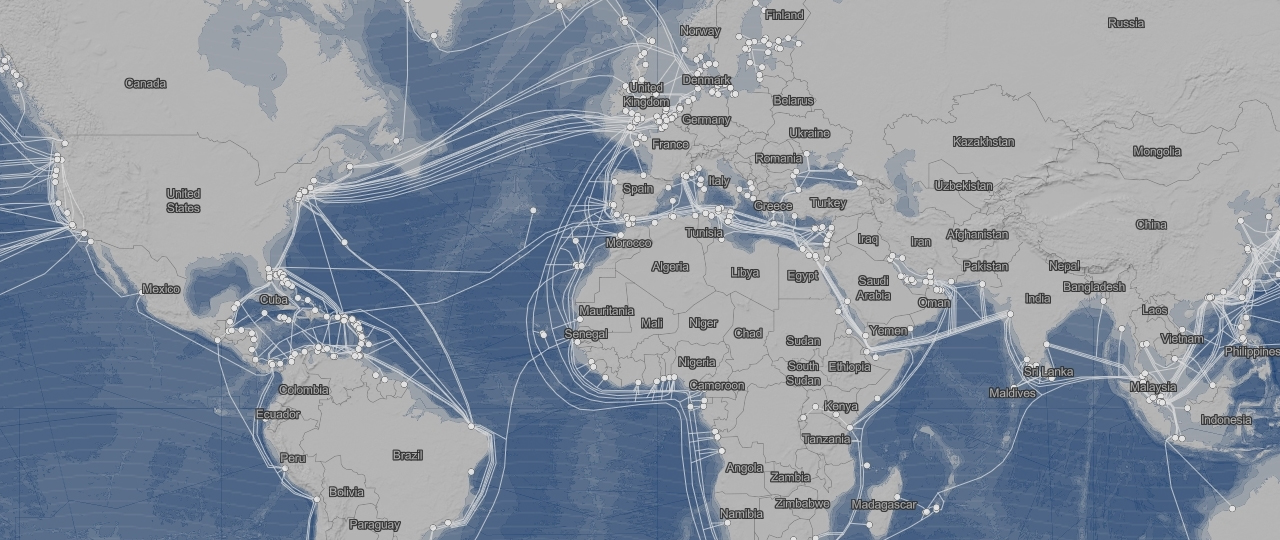
Ever since the industrial revolution the world has become ever more interconnected. As globalization consumes almost every corner of the globe, maps have been created to show how connected the world is. Using undersea cables, I attempted to visualize what areas of the world are connected, especially in a time where so many people are connected to the internet and can interact with each other across vast distances within seconds. Although the undersea cable lines are the prominent factor displayed on the map, it is the background and place names…read more

Analyzing Crimes in Ottawa using CrimeStat

Posted by in Geographic Information Systems

Nearest Neighbour Index By using the nearest neighbor index tool in ‘CrimeStat’, residential break-ins (B&E’s) were found to be less spatially aggregated than auto thefts, however commercial B & E’s are similarly spatially aggregated to auto thefts. The index tends to increase quickly as the nearest neighbour order increases, then starts to level out as it reaches the last nearest neighbour order. The graph in Figure 1 depicts that residential B & E’s are less spatially aggregated, and therefore more random because residential areas are not particularly ruled by laws…read more

Geographically Weighted Regression

Posted by in Geographic Information Systems

Geographically Weighted Regression When looking at changes over space, a typical regression model is not suitable because it doesn’t consider change over space and instead assumes that the processes are static over space. A regression model is a statistical technique that looks at the relationship between a dependent and independent variable. Ordinary Least Squares (OLS), a popular regression technique and common starting point for regression analysis, only provides a global model. OLS only creates a single regression equation to represent the whole process. OLS produces the single best line that…read more

Land Use Change in Edmonton from 1966 – 1976

Posted by in Geographic Information Systems

Executive Summary Between the years of 1966 and 1976, Edmonton saw significant increases in the amount of people residing in the city. The population of 381,230 increased by almost 100,000 to a population of 471,474. (City of Edmonton, 2018). Along with population growth, it is expected that land use changes will occur as the needs of the people and the area change. Our report reveals the extent to which cropland and woodland is being fragmented by the advancement of urban built-up area. It is key that the government develops a…read more

Crime in Vancouver

Posted by in Geographic Information Systems

Summary A crime map of Vancouver was created using both census tracts and dissemination areas. The classes were created from the box plots created using the Ordinary Least Squares (OLS) tool. Within both maps, the Moran’s I values show us that the data has a positive spatial auto correlation, however, this correlation is not close to a value of 1, and therefore is strong. Both maps display somewhat similar patterns when it comes to the number of residential B & E’s relative to the median household income and the total…read more

Digital Terrain Modelling and Multi-Criteria Analysis

Posted by in Geographic Information Systems

Summary A Triangulated Irregular Network (TIN) was created from an elevation dataset for the Osoyoos Lake region. The multi-criteria analysis map was created to meet the criteria set out by the botanist. The criteria focused on in this situation were for an area of 700 hectares,with an importance of aspect over elevation and slope. To create this map, the following steps were taken: A DEM was created from an elevation dataset, with the cell size (resolution) set to 50m x 50m (equivalent to 0.25 hectares). From this DEM, I was…read more

Least Distance & Least Cost Path

Posted by in Geographic Information Systems

Summary Using data provided by the UBC Geography Department, a theoretical proposed feeder line was created using the least cost path tool, where different weights were given to each cell depending on their resistance. A shortest-path route was also created as a comparison. The shortest-path provides the shortest possible route between the source transformer station and the proposed facility. While this is the shortest route in terms of distance, it is not the most cost-effective path as it is likely crossing land which would be expensive to build on. The…read more

Spam prevention powered by Akismet