Land Use Change in Edmonton from 1966 – 1976
Executive Summary
Between the years of 1966 and 1976, Edmonton saw significant increases in the amount of people residing in the city. The population of 381,230 increased by almost 100,000 to a population of 471,474. (City of Edmonton, 2018). Along with population growth, it is expected that land use changes will occur as the needs of the people and the area change. Our report reveals the extent to which cropland and woodland is being fragmented by the advancement of urban built-up area. It is key that the government develops a land use plan which acts to prevent further fragmentation, while supporting urban growth in non-productive areas.
Introduction
Urban expansion due to growing population causes specific concerns in terms of the loss and fragmentation of agricultural land. Prime agricultural land has been the source for major urban developments throughout all of Canada. (EC, 1989). While some have claimed that loss of agricultural land is not important to the sustainability of a city and restricts the growth of urban areas, it is imperative that the impact on agricultural land is monitored in order to make further judgements. (Hansen, 1984).
Looking at land use change within a city allows for further insight into how the landscape is changing geographically, why it is occurring, and what implications may follow as a result. While urbans centres such as Edmonton only make up one per cent of the total number of all settlement types across Canada, they have experienced the fastest growth, bringing along rapid land use changes. (Warren and Rump, 1981).
To further understand how the development of urban areas is having an impact on the landscape of Edmonton. The goal of this report is to create a deeper understanding of land use changes that have been sculpting the city of Edmonton, what this land use change means, and finally to produce recommendations on what can be done to prevent any negative change in the future.
Methodology and Data
For the analysis conducted in this report, Canada Land Use Monitoring Program (CLUMP) data was used. CLUMP data was produced from 1966 to 1986, with data collected every five years, corresponding with the years that the Canadian census was conducted. The data contains a cell resolution of 100m by 100m, which holds enough detail to analyzing land use change in Edmonton. The programs used for this report include ArcMap and Fragstats. ArcMap was used to generate the visualization of land use change from 1966 to 1976, as well as to produce data that could be used in the spatial pattern analysis program Fragstats. Fragstats is a program that was designed in association with the USDA Forest Service General Technical Report to compute a wide variety of landscape metrics for patterns occurring on a map. (McGarigal, K., SA Cushman, and E Ene, 2012).
Results and Discussion
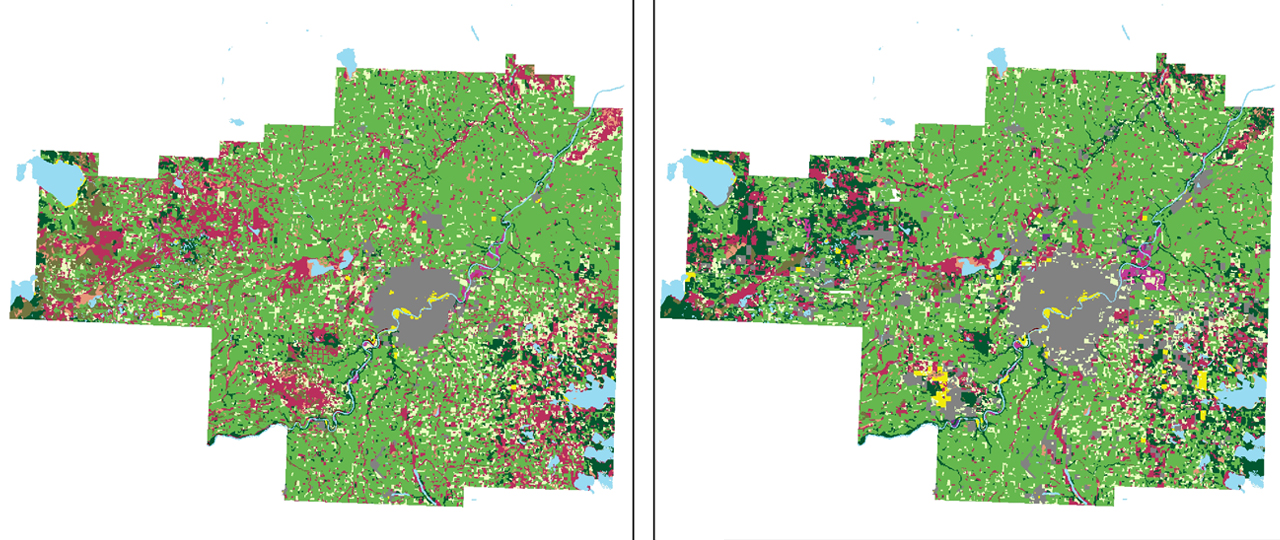
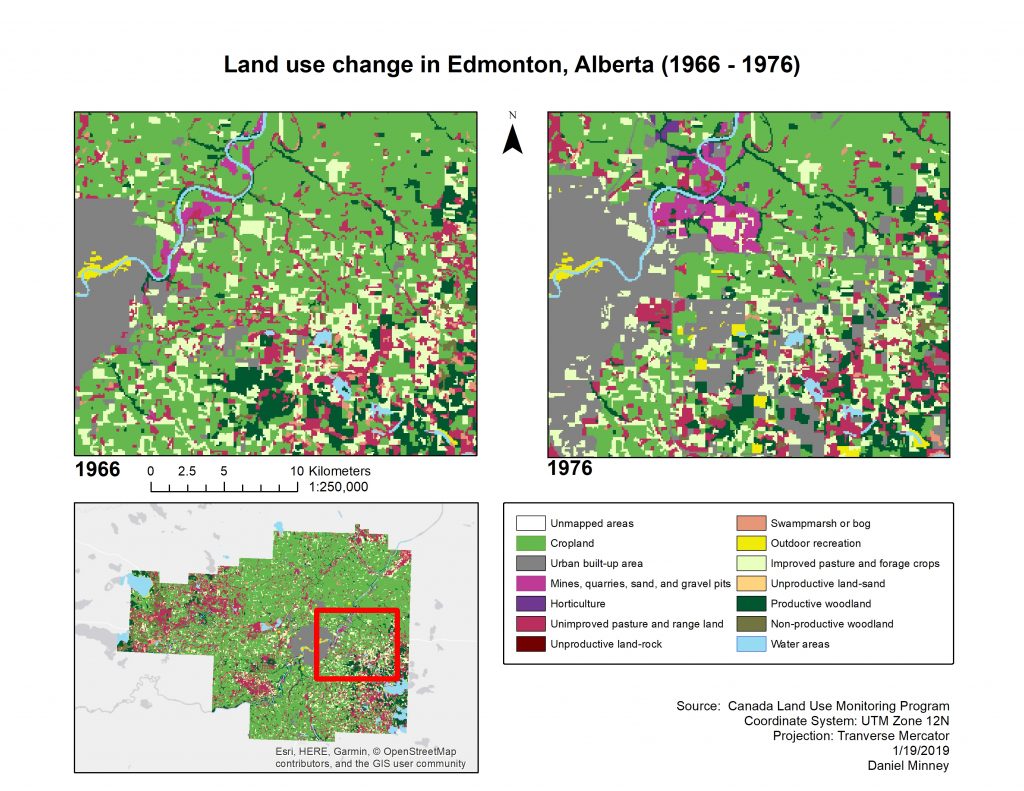
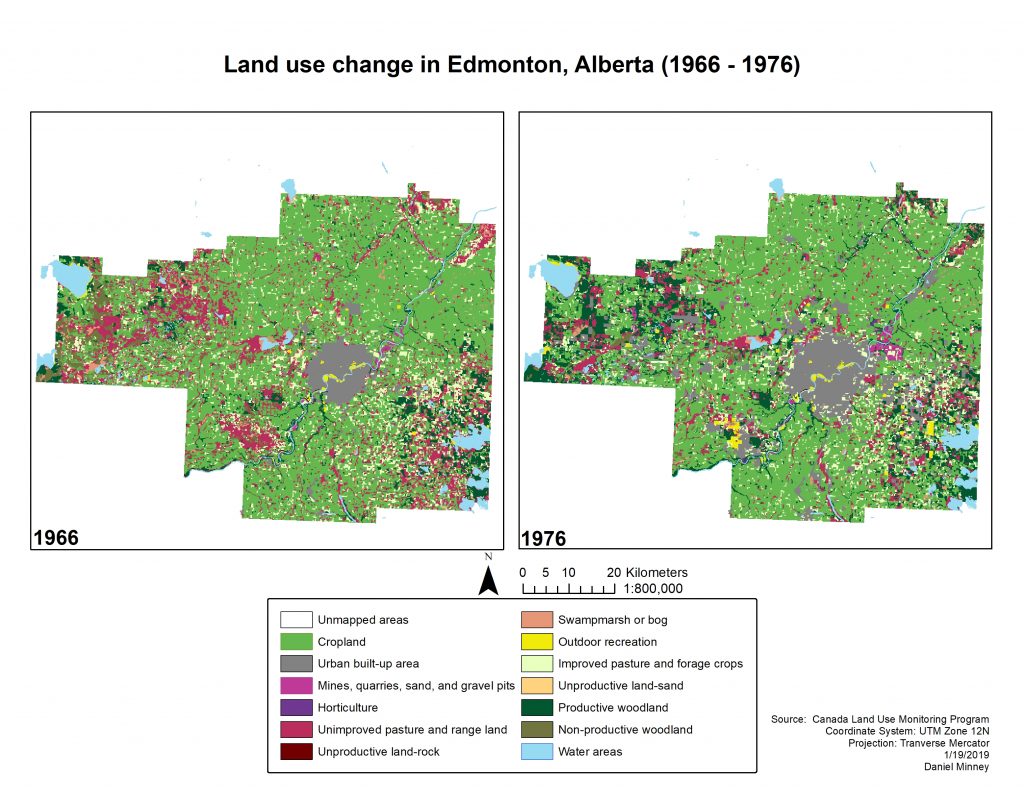
The results from the Fragstats program provided valuable information into the land use changes that occurred between 1966 and 1976. The assumption going into this report was that urban built area, and areas associated with urban growth such as recreational areas, experienced an increase due population growth. With an increase in urban growth we expected there to be a large loss of other land use types, where loss of cropland, improved pasture and forage crops, productive and non-productive woodland, and swamp marsh or bog would be of the greatest concern. Two maps (Figures 3 & 4) were created to work as a visual aid in understanding how the landscape has changed from 1966 to 1976, most notably how urban-built-up area continues to expand from its epicenter. These land use types contain the most concern because they are not easily re-established once they have been destroyed, and even then, the ecosystems may not recover to their initial state.
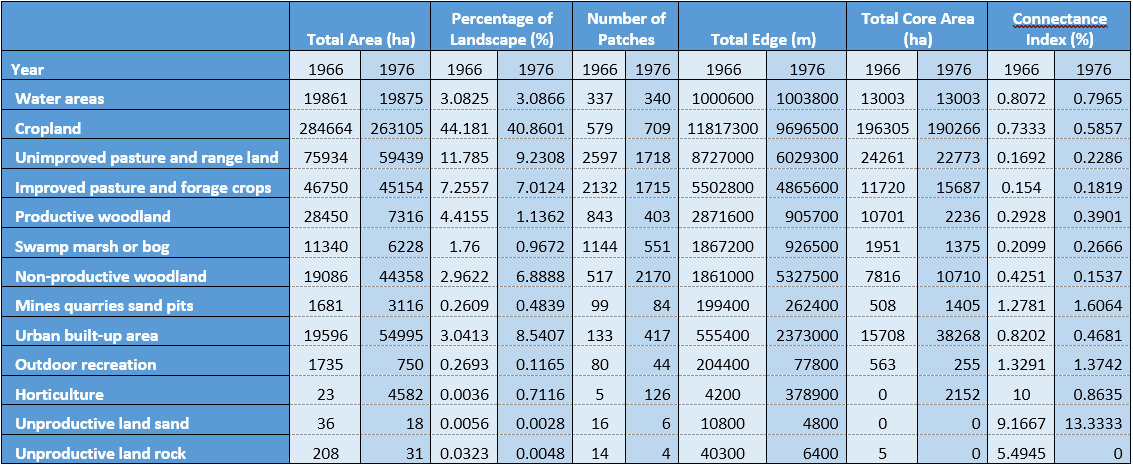
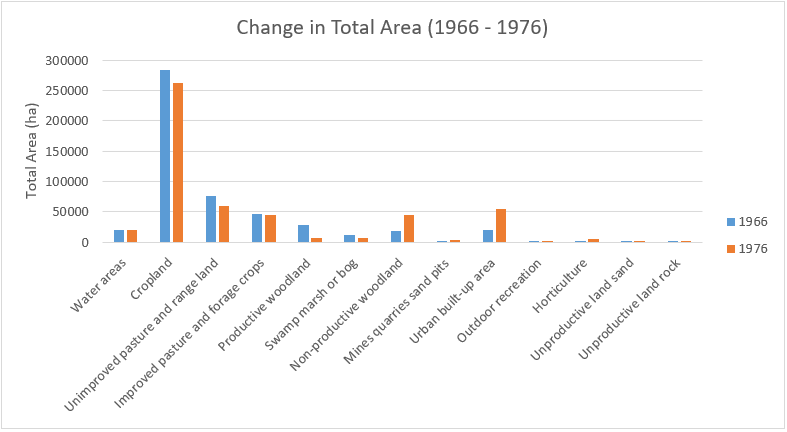
Unfortunately, the results reinforced these concerns, revealing that within this 10-year period, cropland, unimproved pasture and range land, improved pasture and forage crops, productive woodland, and swamp marsh or bogs were subject to a loss in total area. As seen in Table 1 and Figure 1, productive woodland took the greatest hit, losing a total area of 21,134 hectares. Other notable losses included cropland (21,599 ha lost), unimproved pasture and range land (16,495 ha lost), improved pasture and forage crops (1596 ha lost), and swamp marsh or bog (5112 ha lost). Surprisingly, outdoor recreation area also lost a large proportion of its total area (985 ha), which may have been due to urban expansion. Urban built area on the other hand saw an increase of 35,399 hectares, which was expected as the population continued to increase.
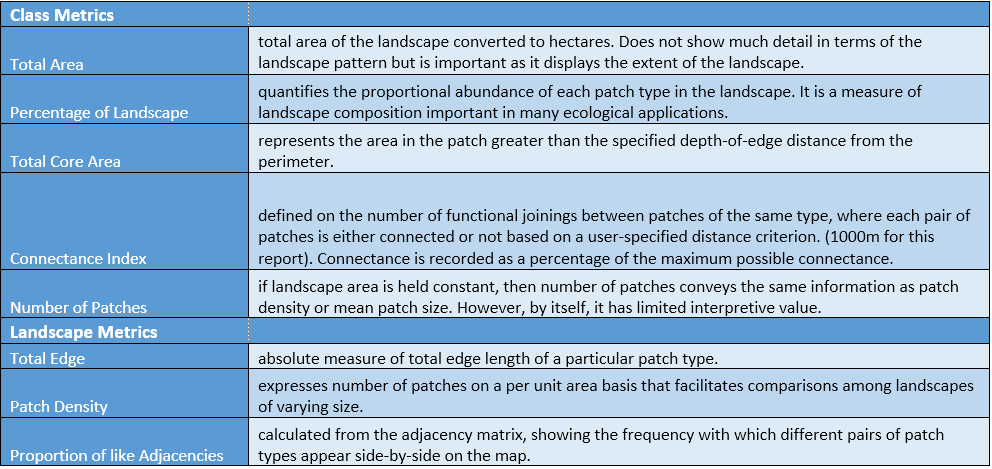
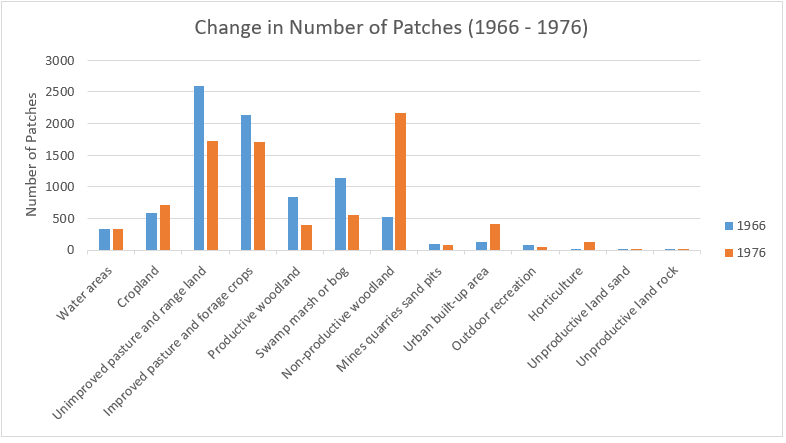
The class and landscape metrics (explained in Table 3), further explain the complexities of this change with more detail than the change in total area. Although cropland lost 8.1% of its total area, the number of patches (Figure 2) increased, from 579 to 709, which means that as the amount of land that makes up cropland is smaller, it has also been split up into smaller patches. The opposite however occurred for productive woodland and swamp marsh or bog, both experiencing a loss in their area and patches, meaning that these land use types are less spread out in 1976 than in 1966. Non-productive woodland interestingly gained a total of 25,272 hectares, but at the same time the number of patches increased from 517 to 2170. It could be speculated that this change in non-productive woodland has occurred to prepare these areas for transformation into either urban built-up area (i.e. housing developments), or for cropland.
The increase in patches which has led to a disconnect between these patches (especially with a decrease in total area), is further confirmed when viewed alongside the connectance index. The connectance index shows the number of functional joinings between patches of the same land use type, displayed as a percentage of the maximum possible connectance. Non-productive woodland, which experienced a large increase in its number of patches, experienced a drop from 45% connectivity to 15% (Table 1). For land uses which experienced a drop in the number of patches, the connectance index increased, as seen through productive woodland which experienced a 10% increase in connectance. Urban built-up area also experienced a decrease in its connectivity index (down almost 40%), likely due to the construction of new housing developments in previously un-developed areas.
Growth in urban built-up areas has also led to a loss in connectivity (down from 82% to 46%) as well as a decrease in core area as a composition of the total area, experiencing a 10% loss. The decrease in core area as a proportion of total area is a concern because it means that new urban developments are disconnected from other main urban areas, and more and more areas are neighboring other land use types. If with 30% of all urban built-up areas are within close proximity, this could potentially lead to concerns regarding side-effects of other land use areas, such as cropland or mines and quarries due to their harmful chemicals.
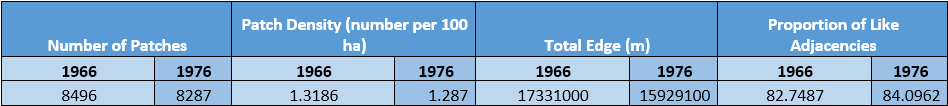
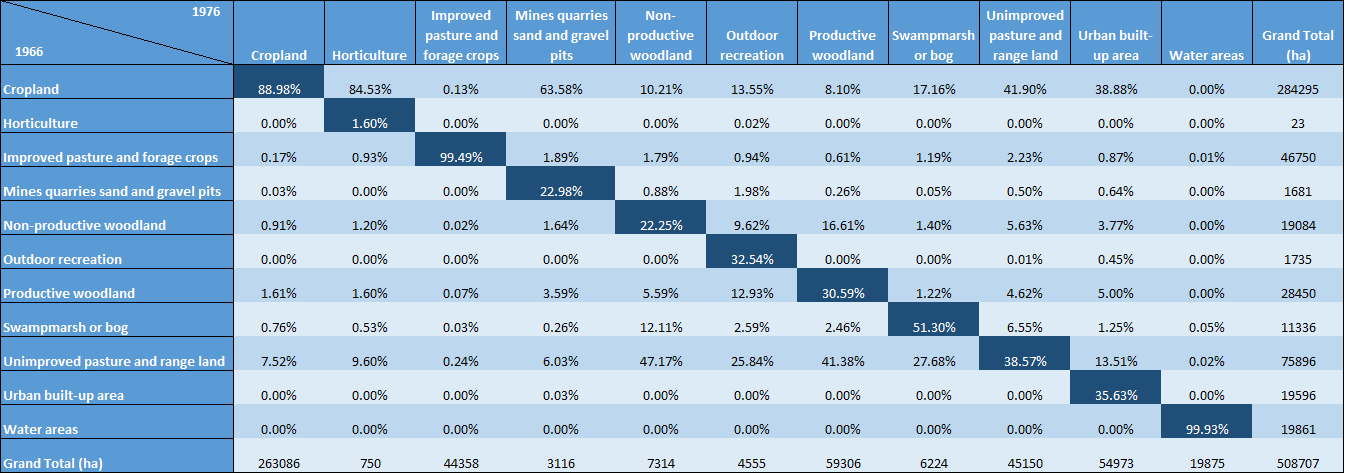
It is evident that the landscape of Edmonton is becoming further disconnected, and that land is being split up to meet the needs of population growth. To further understand how each land use type has changed, a transition matrix (Table 4) was created to clarify what each land use type in 1976 is composed of. For example, 88.98% of what used to be cropland still exists as cropland. Urban built-up area is composed mostly of what used to be cropland, as well as other types such as unimproved pasture and range land, productive woodland and non-productive woodland. While the transition matrix does not explain the extent and complexities of each land use type, it gives further insight into the composition of each land use type. Interestingly, although it seems that a lot of the significant land use types are becoming more and more disconnected, the landscape metrics in Table 2 reveal that overall, the number of patches has decreased as well as the patch density.
Recommendations
The aim of this report was to explore the change in the landscape of Edmonton between 1966 and 1976. As expected, urban sprawl has resulted in the fragmentation of the landscape. We recommend that more research be done into developing better planning tools that can work to avoid fragmentation of agricultural land and forested land, as well as protecting wetlands and grasslands. The loss of total cropland is not a primary concern, it is the fragmentation of the cropland. A land use plan such as the British Columbia Agricultural Land Reserve (ALR) may be useful, with the aim to reduce speculation on farmland and as well as protecting it from being fragmented by the expansion of urban areas. The ALR was proven to have been successful in slowing the growth of urban areas into important farmland. (Hanna, 1997). Without the ALR, it is likely that most of the applications to build on farmland would have been approved, proving its effectiveness. (Hanna, 1997). If an updated land use plan is not implemented, it is likely that fragmentation of the landscape will continue occur.
Tables and Figures
Works Cited
City of Edmonton. Population History. 2018. Retrieved from: https://www.edmonton.ca/city_government/facts_figures/population-history.aspx
Environment Canada (EC). 1989. Urbanization of rural land in Canada, 1981-86, Environment Canada, Conservation and Protection, Ottawa
Hanna, K. S. (1997). Regulation and land-use conservation: A case study of the british columbia agricultural land reserve. Journal of Soil and Water Conservation, 52(3), 166.
John A. G. Hansen. (1984). Canadian small settlements and the uptake of agricultural land, 1966-1976. Social Indicators Research, 15(1), 61-84. doi:10.1007/BF00300478
McGarigal, K., SA Cushman, and E Ene. 2012. FRAGSTATS v4: Spatial Pattern Analysis Program for Categorical and Continuous Maps. Computer software program produced by the authors at the University of Massachusetts, Amherst. Retrieved from: http://www.umass.edu/landeco/research/fragstats/fragstats.html
Warren, C. L., & Rump, P. C. (1981). The urbanization of rural land in Canada, 1966-1971 and 1971-1976 (Vol. 20). Lands Directorate, Environment Canada= Direction générale des terres, Environnement Canada.