Northern Caribou Protection in Northern BC
Abstract
For thousands of years, herds of woodland caribou have roamed British Columbia contributing to the Province’s rich biodiversity and ecosystems. However, within recent decades, the number of caribou has reduced dramatically as significant changes have taken place in their habitats, putting their livelihoods in jeopardy. According to the Government of BC, the number of caribou in B.C. has declined from 40,000 in the early 1900s, to less than 19,000 today. Thus, making woodland caribou an endangered species in British Columbia. There are many contributing factors which alters their habitats, ranging from human disturbances to natural disturbances due to climate change. There are human disturbances which directly affect the herds calving zones and habits. Oil and gas development and seismic lines are major contributors. Many studies have concluded that caribous do not trespass zones where pipelines are built underneath the ground. Additionally, there have been increased development in winter resorts and our recreational activities intrudes their natural habitats. On the other hand, recent climate changes also poses significant threats to the caribous. Many natural hazards such as avalanches and forest fires have become more common and more severe due to rising weather conditions. Lastly, predators such as wolves is another contributor to the decrease in caribou population. Our goal is to identify their natural habitat while considering these disturbances using the MCE analysis from ArcGIS to determine a protection zone with the goal to restore the caribou’s population in northern British Columbia.
Introduction
In order to identify and set up potential protection area for caribous, we must consider both the natural and human disturbances the species face in the habitat area. Both types of disturbances can be detrimental to the survival of the species and we must consider them as equally important. There are many kinds of disturbances, thus, for the scope of our project we have chosen three of the most impactful disturbances from both natural and human types.
Caribou’s habitat area in British Columbia is vast and their habitats generally covers interior B.C. closer to the higher altitudes and away from the west coast. There are also different species of caribou which are boreal caribou, mountain caribou, and northern caribou. The study area of our project is north eastern British Columbia and the species we have chosen is the Northern Caribou which are distributed in the northern parts of the province
Until recently, these caribou have
maintained a relatively robust population. However, the latest
monitoring results have indicated that the population of these herds may
be declining. Threats to these caribou are similar to threats to boreal
caribou, including habitat loss, fragmentation and alteration, and
increased predation likely related to increased development pressure in
their ranges. Therefore, according to the government of BC, current
conservation plans include land acts reserves that contribute to the
conservation of wildlife habitat. This is specifically outlined in Land
Act section 16 and section 17.
Additionally, ungulate winter range management plan is another example
which defined as an area that contains habitat that is necessary to meet
the winter habitat requirements of an ungulate species.
Due to caribou being an endangered
species in BC, we believe it is crucial in creating plans that directly
address the caribou habitat as these management plan cover a wide range
of wildlife.
This project attempts to use Geographic Information System (ArcGIS) to identify appropriate caribou protection area using identified natural and human disturbances and the current caribou habitat. It is by no means a complete and accurate identification of the protection zone, but it is an attempt to show that GIS analysis tools can aid us in highlighting these areas given the different disturbances.
Methodology
The natural disturbances considered for the caribou protection zone include avalanches and forest fires. The form of avalanche considered in this study was wet-slab avalanches, which usually occur during spring when surface layers in the snowpack begin to melt, causing instability. Wet-slab avalanches were chosen because they are more likely to occur than winter avalanches, which requires heavy snowfall for instability, introducing the additional factor of weight. (Backcountry Access, 2017). The previous study conducted by Darren Schouls and Hugh Nicholas was used as a reference due to the extent of the project, and the focus being on overall caribou disturbances, where time limited the detail of the avalanche risk. The five factors used for the multi-criteria evaluation (MCE), as outlined by Nicholas & Schouls, are elevation, slope, wind, aspect, and curvature.
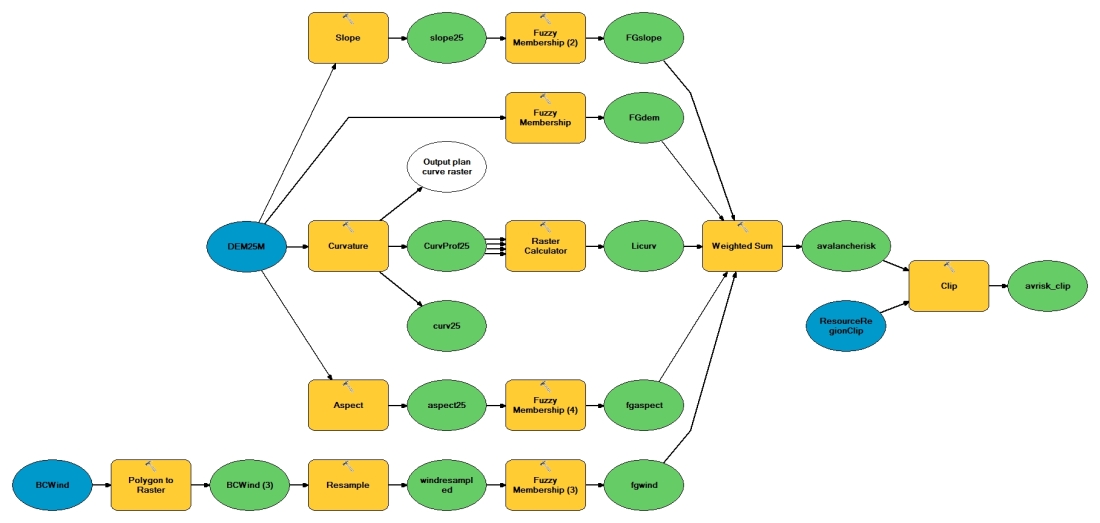
Creating data for the Avalanche Risk MCE
A 25×25 resolution DEM was used to create slope, aspect, and
curvature. Wind had to be transformed from a polygon to a raster and
then was re-sampled to 25×25 resolution so that it matched the
resolution of the other data.
Normalizing the Factors
The weights for each of the factors were given based on their
contribution and importance in triggering an avalanche. The reasoning
behind each of the weights can be seen in Nicholas & Schouls’ study,
however simplified reasoning will be given here.
All of the factors were normalized so that when the MCE is conducted,
the values can be compared equally. All factors, except for slope
curvature, were normalized using the fuzzy membership tool in ArcMap,
transforming all values to a scale of 0 – 1, where 1 equals the greatest
likelihood in forming an avalanche.
Elevation used the linear membership function, where 650 was set as
the maximum. 650 was set as the maximum because above 650m, it is
expected that snow pack will be able to form, which is key for avalanche
formation.
Slope angle used the Gaussian membership function, where 38 was set
as the midpoint. 38 degree slopes were identified as the most
susceptible to avalanches, therefore chosen as the midpoint. Angles
above 38 degrees are too steep to form snow pack, and angles below 38
are less likely to trigger an avalanche.
Slope aspect used the Gaussian membership function, where 180 (south)
was set as the midpoint. South was set as the midpoint because during
spring, it is most susceptible to sliding and radiation from the sun.
Wind used the linear membership function, where increasing wind speed
was expected to have a higher chance in triggering avalanches. The
maximum value of the data was therefore set as the maximum value for the
function.
Slope Aspect was created from the DEM using the profile output. This
means that values that are negative are convex, 0 values are linear, and
positive values are concave. Since a convex curvature causes tensile
strength, leading, this can lead to sliding of the snow pack. Since
values needed to be reversed so that 1 equals convex slopes, the raster
calculator tool was used to reverse the values.
Once all the data was created, an MCE could be conducted using the weighted sum tool.
| Factor | Weights |
| Slope | 0.4 |
| Elevation | 0.25 |
| Curvature | 0.05 |
| Aspect | 0.15 |
| Wind | 0.15 |
Creating the Natural Disturbance MCE
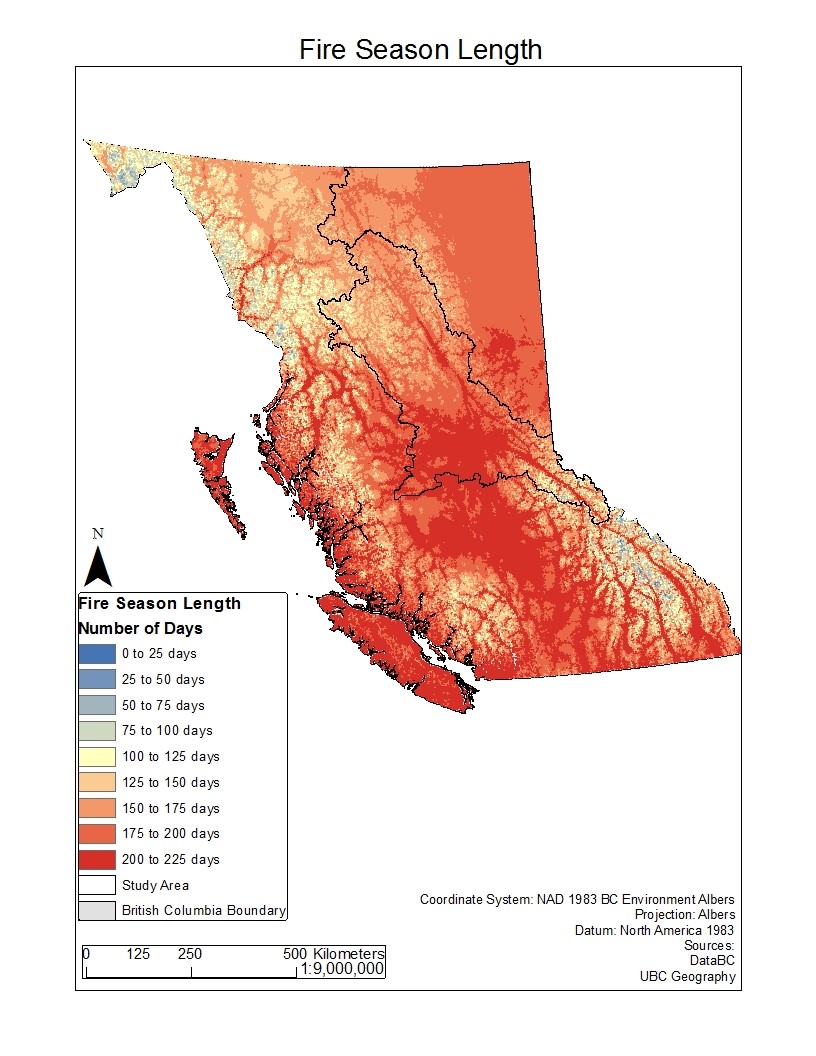
The other factor that was included in the MCE was Fire Danger. After
thorough investigation and attempts at creating a fire risk dataset for
British Columbia, an alternative dataset of Fire Season Length was
chosen. Although fires season length does not accurately depict fire
danger, it uses fire weather to estimate the start and end of the fire
season length. Fire weather is the weather conditions required to
trigger the start of a fire. Wildland fires are detrimental to
ecosystems and specifically have the potential to destroy caribou
habitat.
Current fire season length was used, and was weighed as more of a
factor towards natural disturbance due to its ability to not only kill
caribou but destroy caribou habitat. Fire season length was normalized
using linear membership function, where a longer fire season was
associated with a higher risk to the caribou. Avalanche MCE was already
normalized. The Natural Disturbance was created using the weighted sum
tool. The weights were as follows:


Human Disturbances
Human disturbances were considered because caribou avoid open areas
(ex: those clear cut by forest harvesting) or areas with human
constructions (such as roads or pipelines), further limiting their
habitat area. (Pofus et al, 2011, p.2637). The human disturbances
considered are oil & gas developments (pipelines and facilities),
roads, forest harvest areas, and recreational areas. Since caribou are
known to avoid these human disturbances, we decided to utilize sieve
mapping using Boolean overlays. To achieve this, the erase tool was used
to erase areas identified as human disturbances from the caribou herd
layer.
| Factor | Weights |
| Avalanche | 0.2 |
| Fire Season Length | 0.8 |

Results and Discussion

Because this study focuses on the Northern Caribou, it is only
necessary to clip the polygon layer where the Northern Caribou
population inhabits in upper British Columbia.

In order for the study to be conducted, an avalanche risk map was
created in order to assess the risk levels associated with mountain
ranges (i.e the Rocky Mountains) which have the greatest risk levels as
opposed to the lower elevation forested areas or plains. Fire season
length was also used to create the natural disturbance MCE.

The human disturbance map shows areas which have been affected from
human built structures, where in this case oil and gas developments,
roads, and forest harvest areas were considered. Forest harvest areas
take up a large amount of the area disturbed by humans. Pipelines and
roads are also of concern because they act as barriers which the caribou
will not cross, potentially splitting up their herd area.
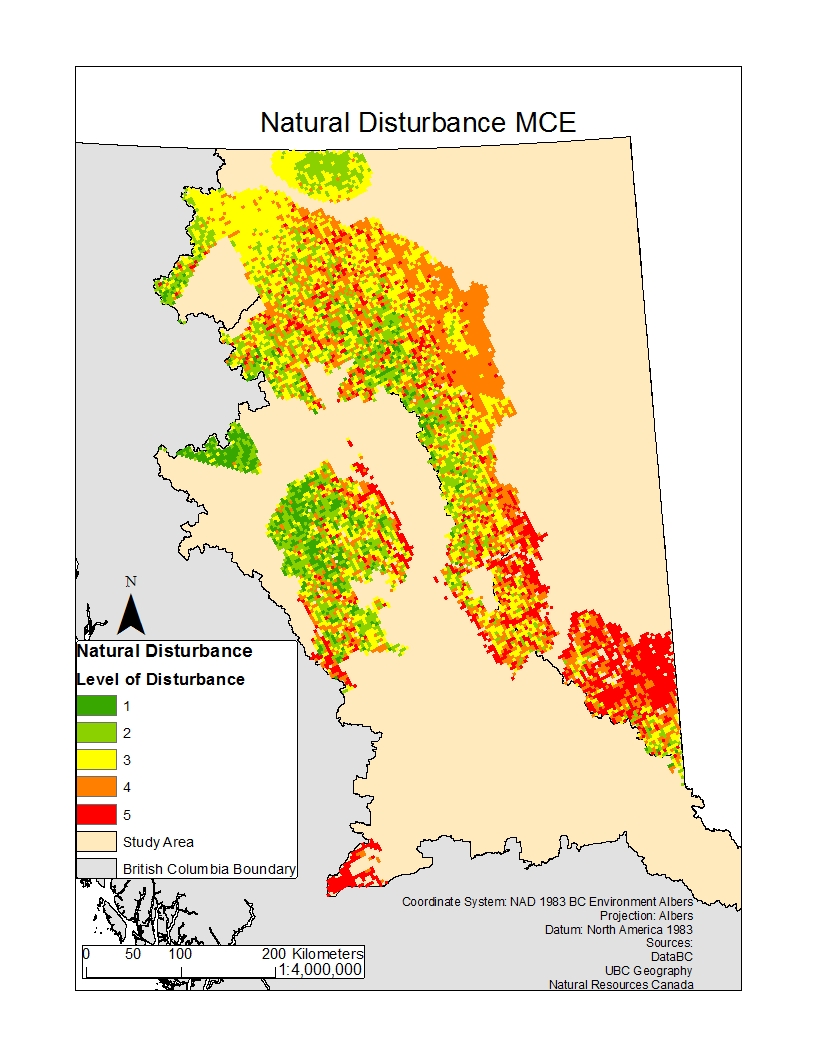
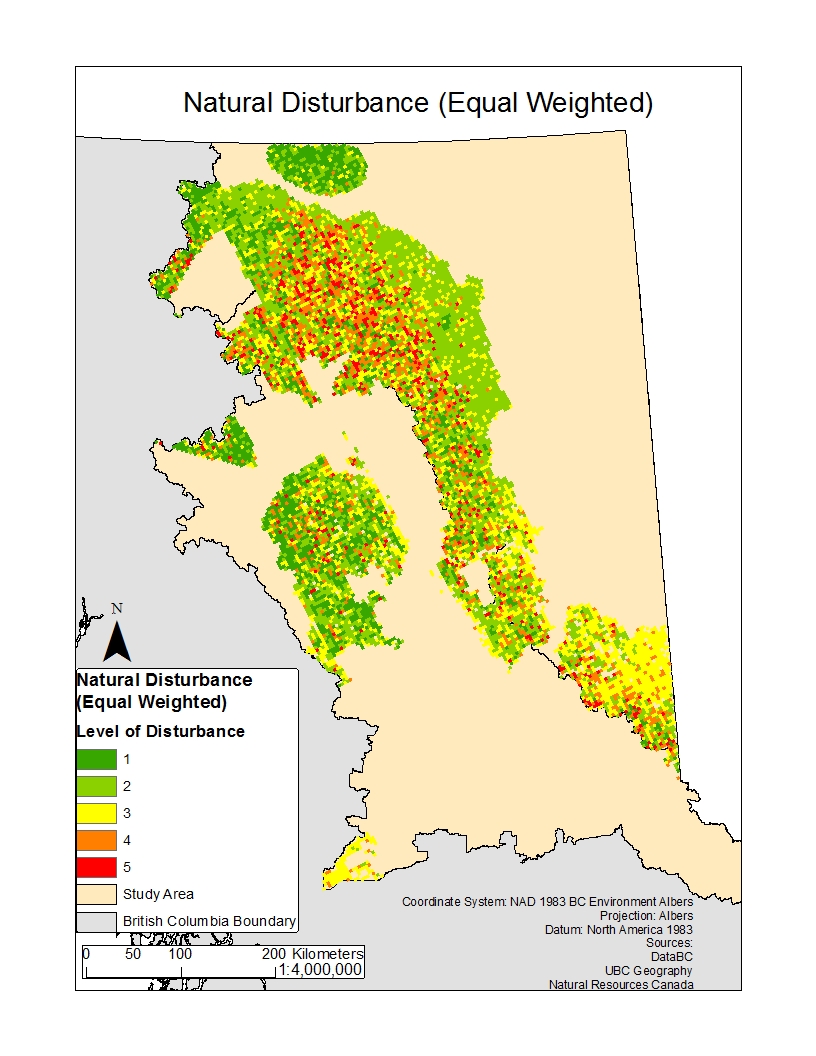
The Natural Disturbance MCE highlights areas of greatest threats. The
polygons for human disturbances have been erased from this map because
it is evident wildlife species will often not look to inhabit areas of
land use change. The red indicates the greatest level of threats to
lower elevation areas (habitat zones) potentially caused by long and
more damaging fire season lengths. Generally, there is lower risk in
high elevation winter ranges where there are infrequent fires. Greater
variability in weather is expected to increase as climate change
continues, in turn increasing the severity and reoccurrence of forest
and wild fires. The most optimal, least threatened area by natural
disturbances within the Caribou habitat zones corresponds to levels 1 or
2. An equal weighted MCE was also conducted for natural disturbances
that shows the alternative results if avalanche risk and fire season
length were weighted equally (50/50).
Conclusion
The maps created are a general representation and by no means an accurate depiction of the possible impacts on Northern Caribou habitats. There are noticeable high-risk areas of fires that affect forage availability altering the movement patterns of Caribou. Predation has been found to increase as a result of habitat fragmentation, both from human and non-human disturbances (e.g. clear cutting, oil and gas lines, forest fires), and was therefore not included in the natural disturbance MCE. (Wittmer et al, 2005, p.265). Because the availability of accessible data was limited to fire season lengths, it is not a direct measure of fire risk. The Fire Weather Index is the most suitable indicator for fire danger or intensity, and would preferable be used moving forward in any future studies. The avalanche risk MCE only includes static variables, omitting variables such as change in rain and temperature over the avalanche season. Additionally, recreational areas were unable to be mapped due to the lack of spatial data (measurable size by areas). If there was access to the specific area of the recreational areas, then this would have been considered in the human disturbances. It is important to note that this model does not account for future scenarios as the data we have used for this is limited to the current time period, therefore change in climate over time and future development has the potential to further impact the Caribou herds.
Additional Information
Data Sources
DEM (25m resolution): UBC Geography Department
Roads: UBC Geography Department
Base Map of BC: UBC Data Library
Oil and Gas Pipelines: Data BC
Forest Harvest Areas: Data BC
Winter recreation location: Data BC
Caribou habitat zone: Data BC
Images Referenced
Header image: Troy B. Thompson [Flickr]
Works Cited
Backcountry Access. (2017). Avalanche Safety and What to Look for in
Spring Snow Conditions. Obainted on 11/27/2018. Available at: https://backcountryaccess.com/spring-snow-conditions-avalanche-safety/
Natural Resources Canada. (2017). Fire Weather. Obtained on 11/27/2018. Available at: https://www.nrcan.gc.ca/forests/climate-change/forest-change/17776
Polfus, J. L., Hebblewhite, M., & Heinemeyer, K. (2011).
Identifying indirect habitat loss and avoidance of human infrastructure
by northern mountain woodland caribou. Biological Conservation, 144(11), 2637-2646. doi:10.1016/j.biocon.2011.07.023
Wittmer, H. U., Anthony R. E. Sinclair, & McLellan, B. N. (2005).
The role of predation in the decline and extirpation of woodland
caribou. Oecologia, 144(2), 257-267. doi:10.1007/s00442-005-0055-y