Web mapping with MapBox
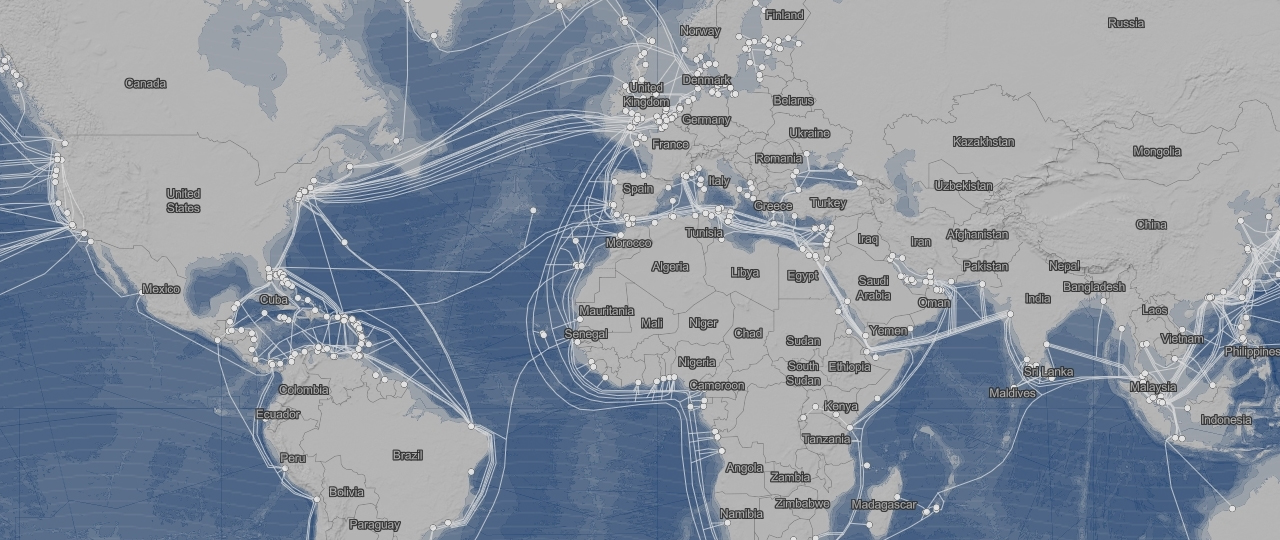
Ever since the industrial revolution the world has become ever more interconnected. As globalization consumes almost every corner of the globe, maps have been created to show how connected the world is. Using undersea cables, I attempted to visualize what areas of the world are connected, especially in a time where so many people are connected to the internet and can interact with each other across vast distances within seconds.
Although the undersea cable lines are the prominent factor displayed on the map, it is the background and place names which allow for a better context and visualization. The ocean is the focus of this map, so using bathymetry data seemed natural as it was used to present a visualization of the sea floor, where shallow areas could be expected to correspond with cable routes. Because this adds a 3-D effect to the map, I felt it was important to continue this over to land areas by using a hill shade layer. However, I didn’t want these features to stand out too much, so the intensity was lowered. Additionally, a wavy texture was added to the bathymetry layer to provide more texture, as well as providing more visual importance.
Visually, muted colours were used for most of the map, with the brightest colours used for the cable routes and cable landing stations. The obvious colour of blue was given to the bathymetry layer, and the intensity of the colours was designed to increase as you zoomed in, giving more depth and contrast between the seafloor elevation levels. Undersea cable lines and landing stations were also designed to decrease in size when zoomed out to prevent clustering. Contrasting this, zooming in increases the size which makes it easier to see. Place names were also adapted to appear and disappear over different zoom levels. Overall, the map could be improved by using more dynamic data, such as different colour for types or lengths of cables. Change over time in the amount of cables would also provide an interesting visualization, if the data exists.
The map can be viewed here
The stylesheet json file can be seen here