Quantitative Data Classification and Housing Affordability in Vancouver, BC
Summary
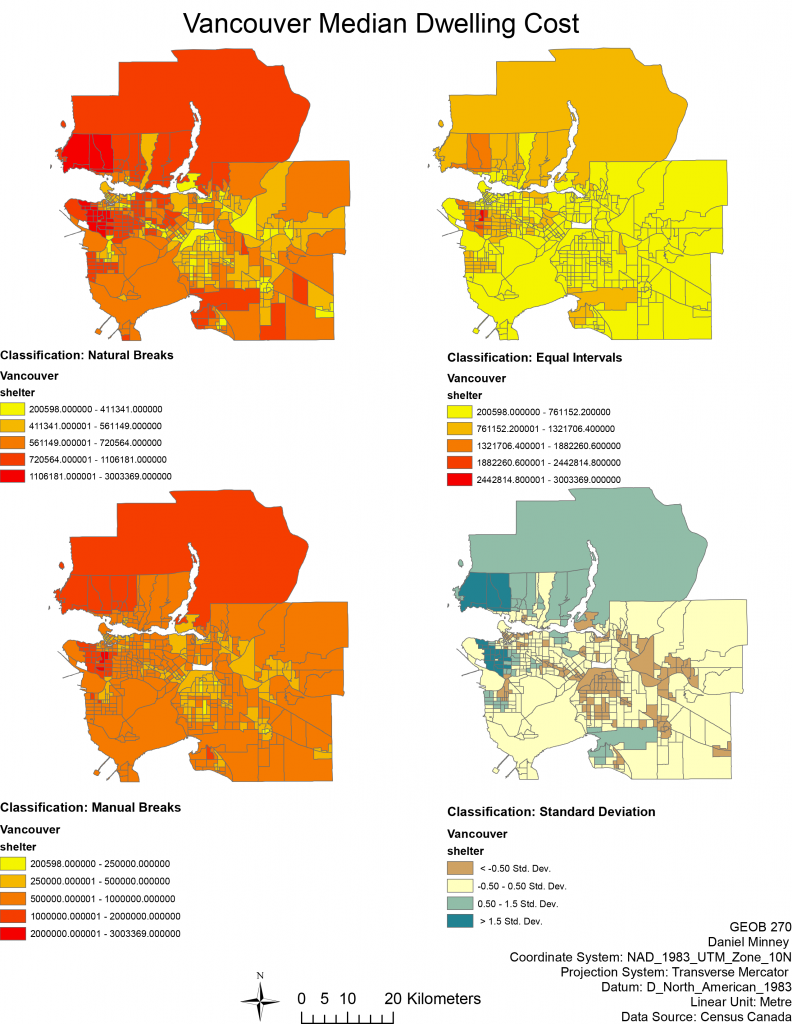
The four maps use different classifications to display median dwelling cost in Vancouver, BC. As a journalist a natural breaks map would be good at displaying how expensive Metro Vancouver without distorting the breaks. A real estate agent may want to use a map showing manual breaks as it presents the information as easy to understand with clear breaks. Different classification methods can be used to visually trick people into thinking areas are cheaper than they appear. For example, if you were to use an equal interval map, it shows the ‘cheapest’ area as yellow, with a range from ~$200,600 to ~$761,000. With such a large range, many areas may have a median closer to the $761,000 price, but people may quickly assume that these areas have the possibility to have a cheap median.
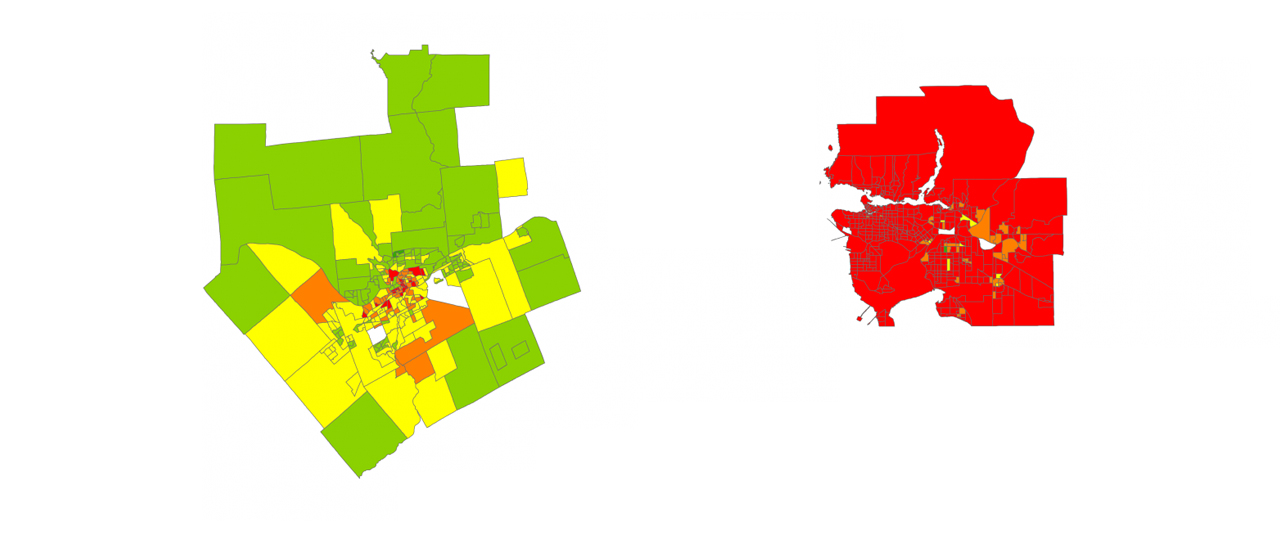
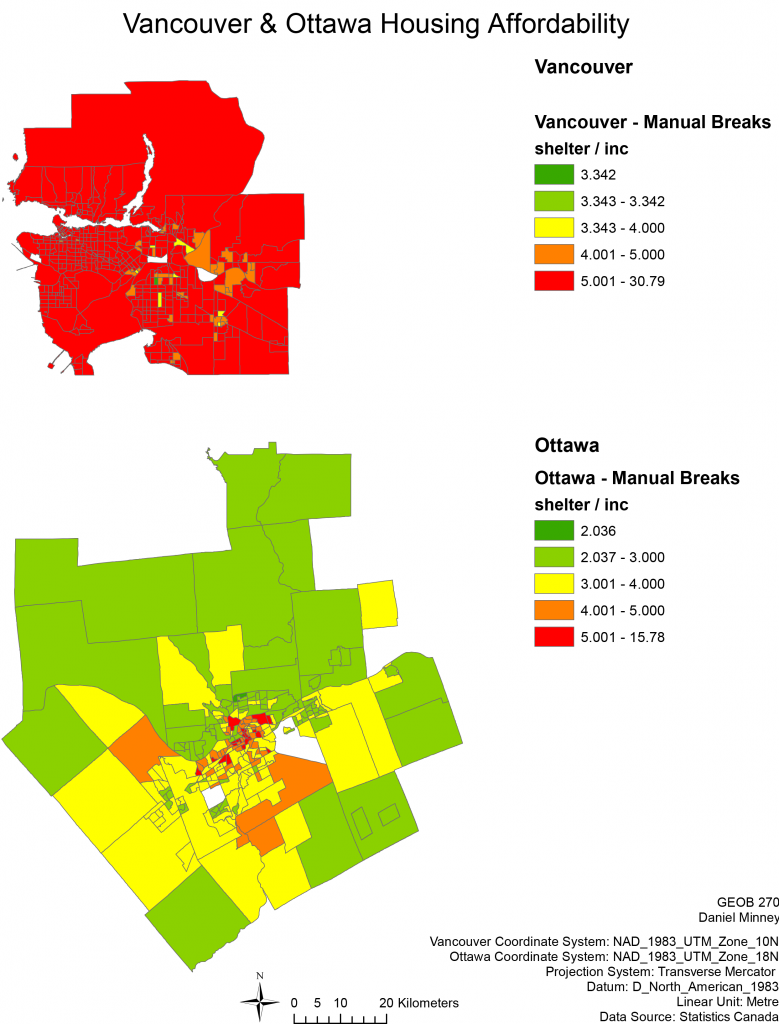
Housing affordability is measured using the ‘Median Multiple’, a price-to-income ratio. Median Multiple is the median house price divided by gross annual median household income. Housing cost alone doesn’t show if a housing market is affordable, it just shows the price in relation to nothing. The Median Multiple is also specific to a specific housing market.
The housing affordability rating categories are Affordable, Moderately Unaffordable, Seriously Unaffordable, and Severely Unaffordable. This is provided by the Demographia International Housing Affordability Survey. They have been producing the survey for 13 years. The Median Multiple is widely used for evaluating urban markets, and has been recommended by the World Bank and the United Nations.
According to the United Nations, “If there is a single indicator that conveys the greatest amount of information on the overall performance of housing markets, it is the price-to-income ratio.” Affordability is a good indicator of a city’s ‘livability’. Middle-income households must be able to afford adequate housing, if they cannot then a city cannot be livable. If income has been spent mainly on housing, then there is less money left over for other needs and desires.
Accomplishments
Gained an understanding of the different classification types, and how each one can be used for different situations, and how they can be exploited to distort information, leading to false assumptions.