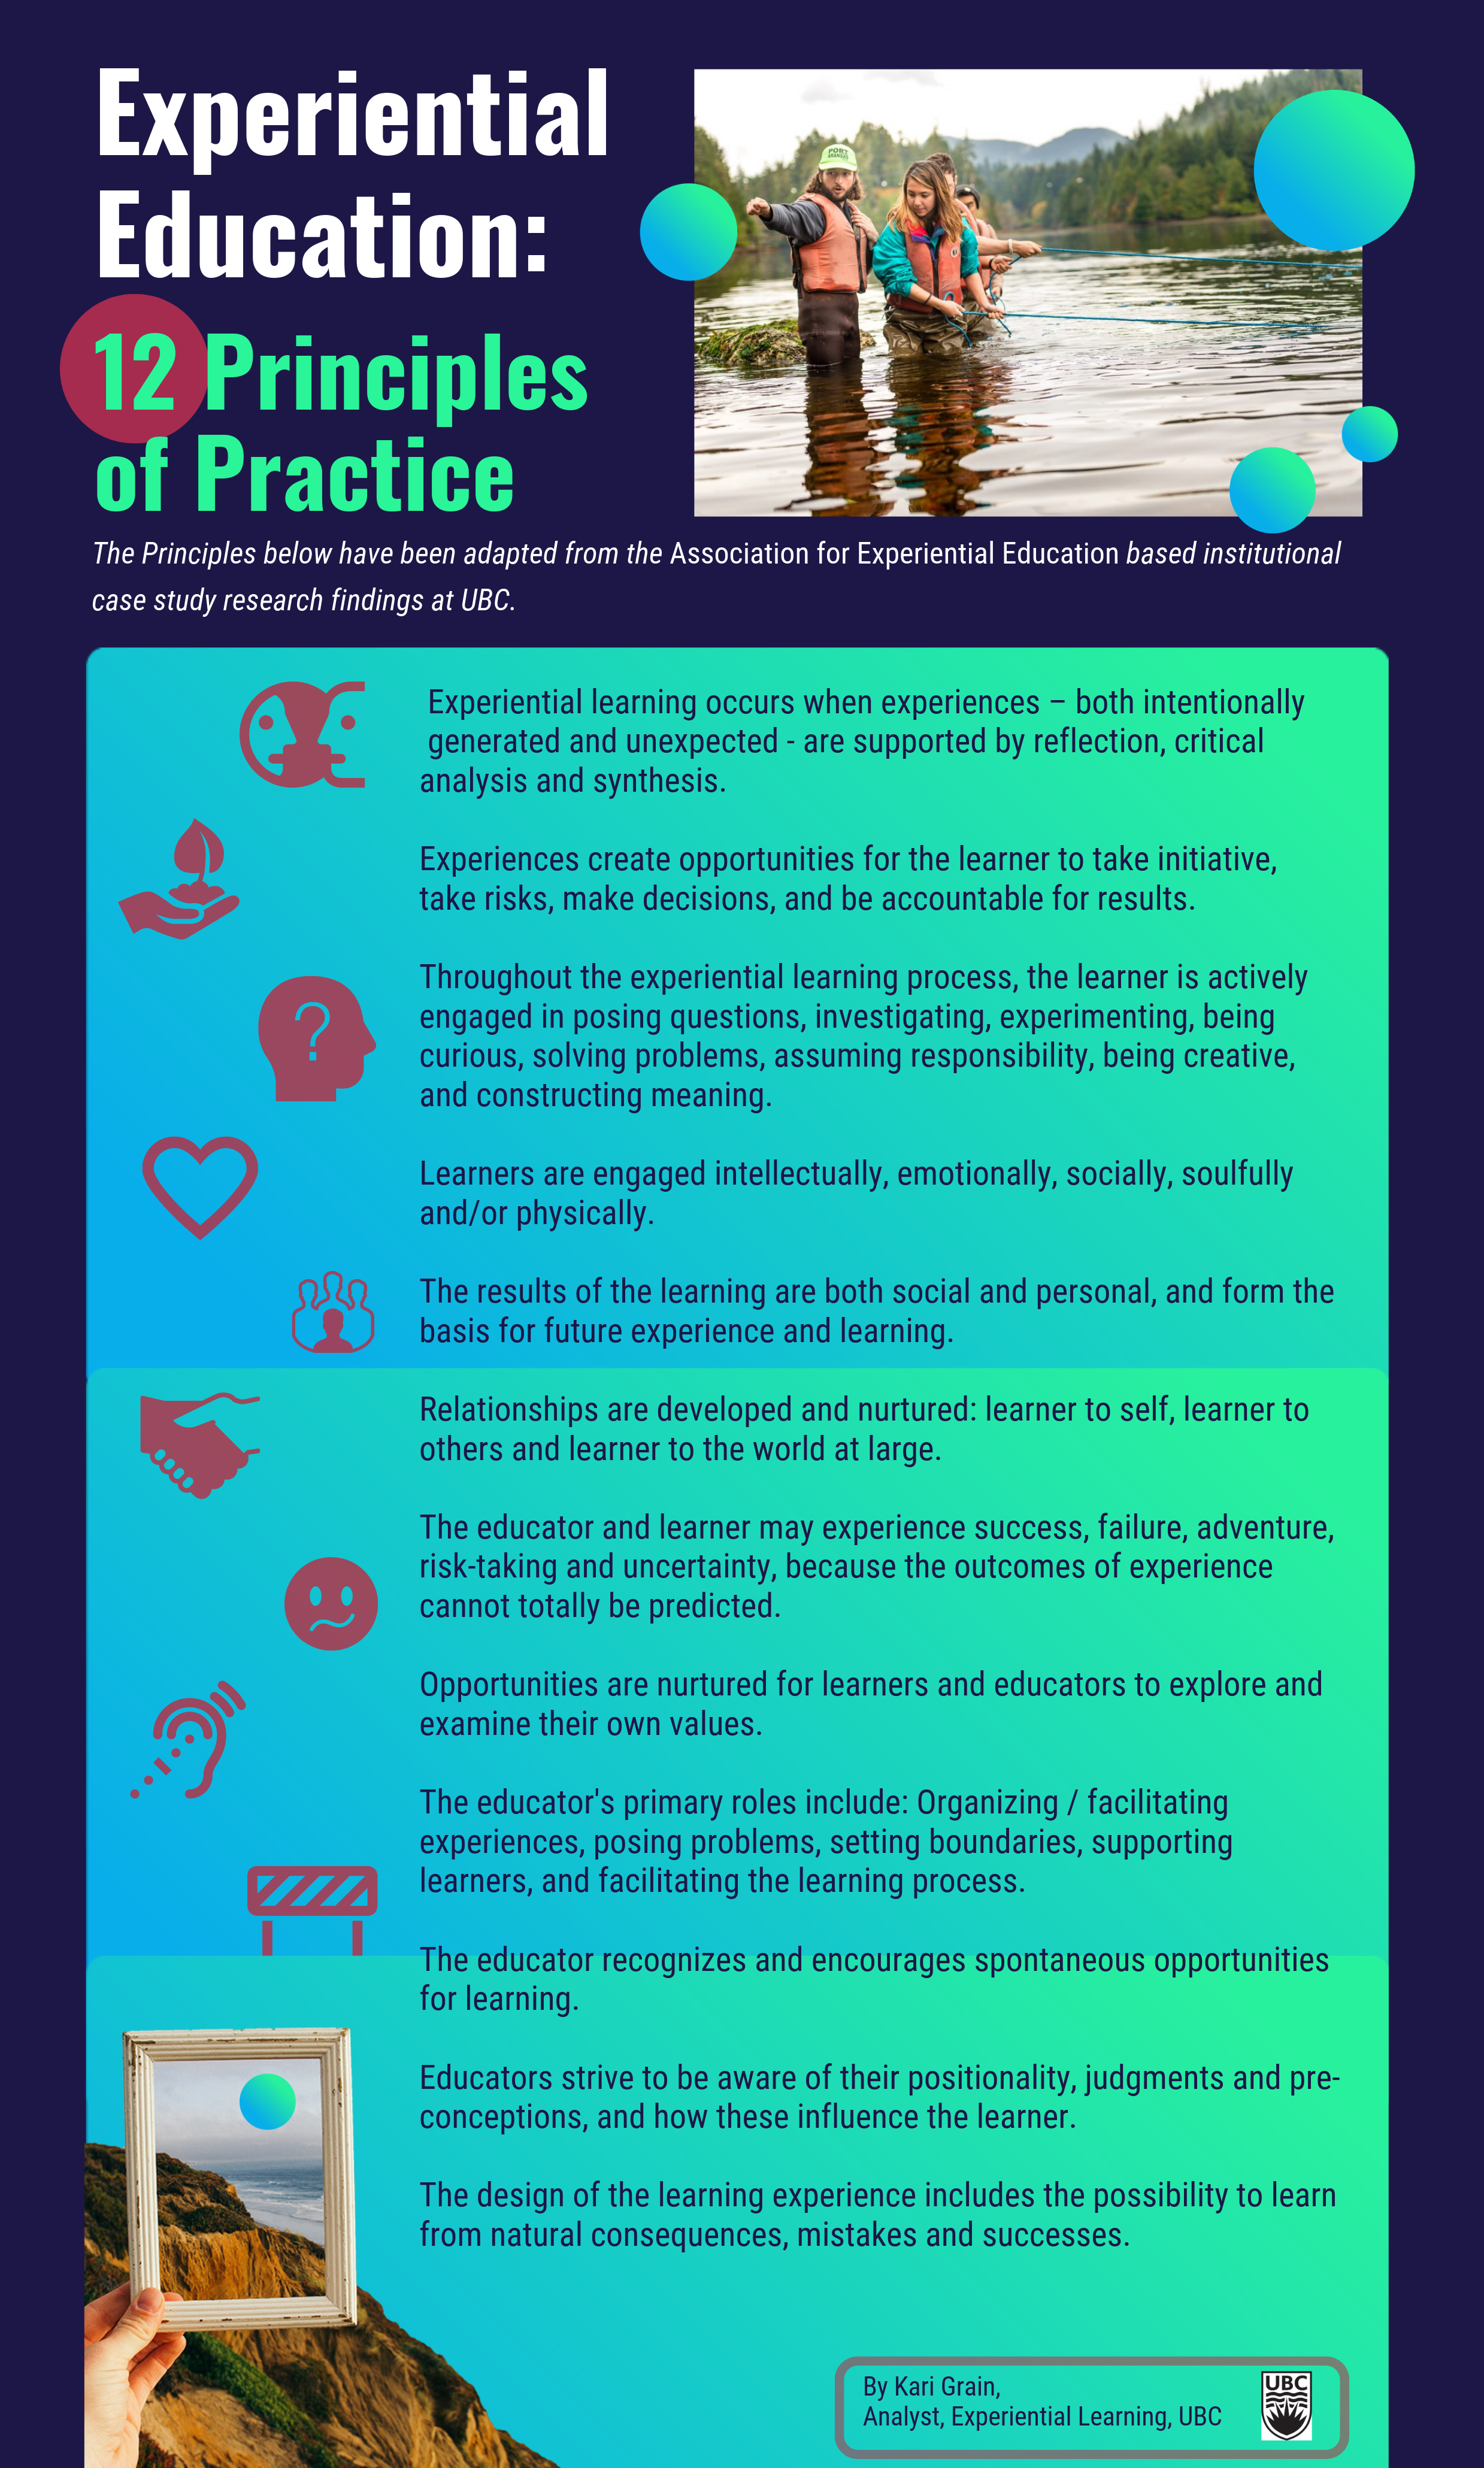
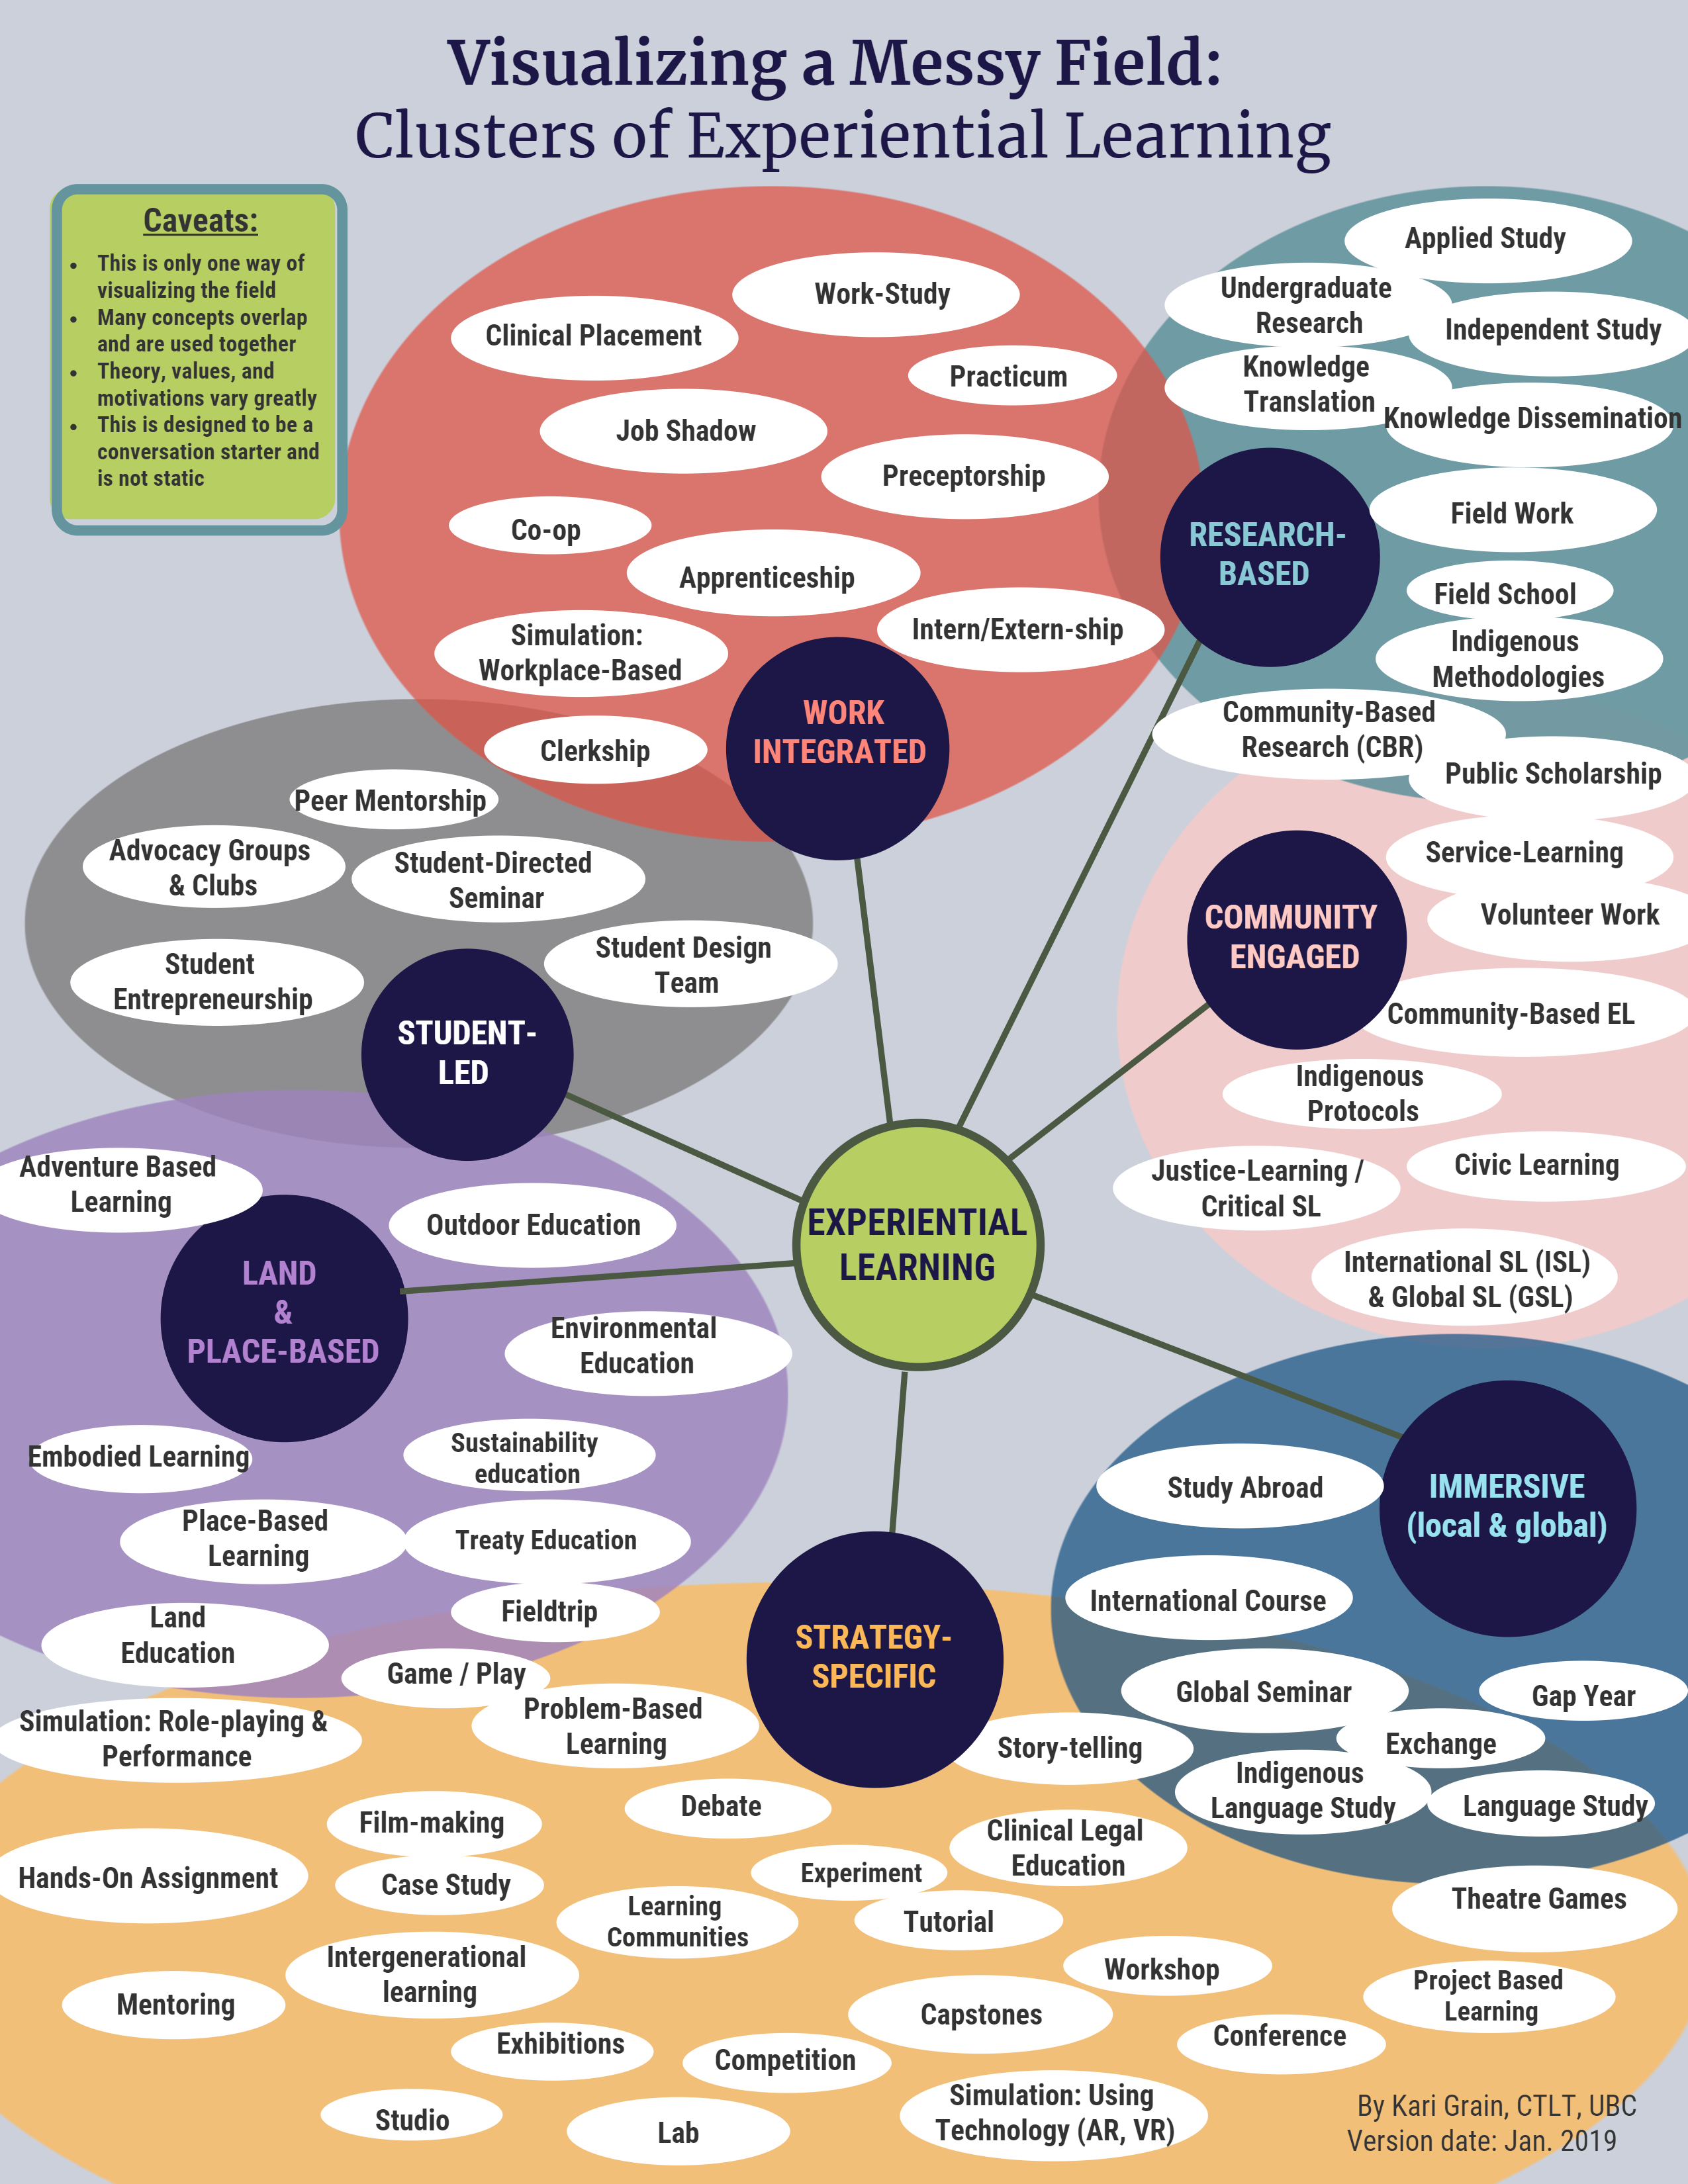
This page will host various EL-related maps and visuals that I develop over the course of this project. Two of the key foci for this project are to Understand and Communicate findings about experiential learning at UBC. Visualizing the field in different ways can help to achieve these goals, identify tensions, and generate conversations. *All visuals are subject to transformation and reconceptualization.
In advance of these visuals, I echo here the words of Tara Fenwick (2000), who wrote of the limitations of her own visual representations of experiential learning typologies: “Besides the reductionist, binary, and reificatory logic that apparently construct it is the specter of its reproduction and distribution as a pedagogical tool, stripped of the important complexities and inner contestations that I fervently hope will bubble heatedly in any dialogue precipitated by display of this chart” (p. 247)