This week saw the wrap up of work on Lab 2, and introduction of statistics. We started off with a review of basic statistics, by looking at measures of central tendency (e.g. mean), variability (e.g. standard dev.), as well as more advanced measures such as skewness and z-score.
We then learned about statistical measures of association, such correlation, cross-tabulation, and regression modeling, which look at relationships between a dependent (response) and independent (predictor) variable.
We look at regression modelling in particular detail, as it is a practical and frequently-used method of analysis. Some of the related concepts we learned about were OLS, collinearity, iid (independent and identically distributed) errors and spatial declustering. We also learned about geographically-weighted regression, which is a tool used in ArcMap to account for spatial variance in regression modeling.
Lab 2 Work:
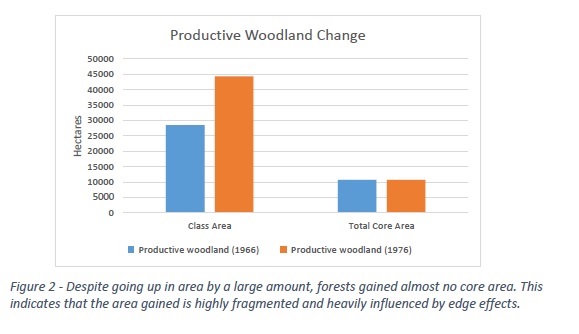
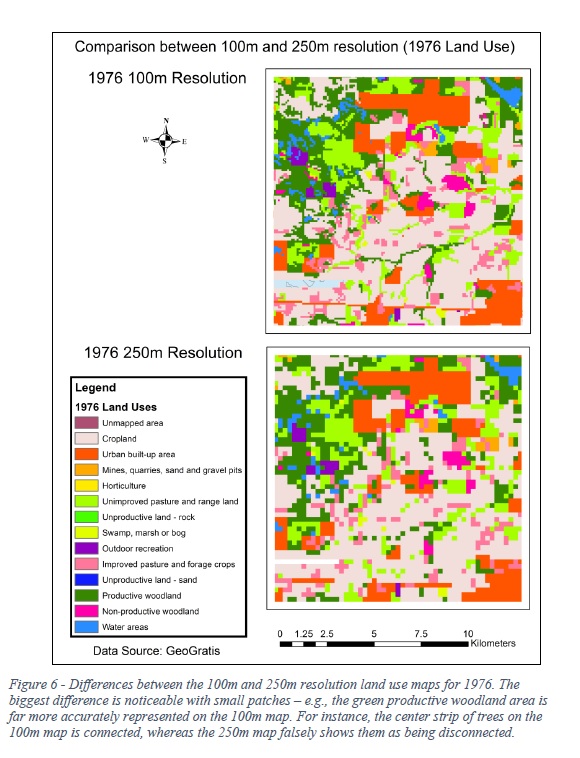
I finished up lab 2 this week, which looks at land use changes from 1966 to 1976 in and around Edmonton, Alberta. The additional variables I chose were Simpson’s diversity/evenness for landscape metrics, and total core area/patch cohesion index for class metrics, with the goal of looking at changes in forested areas in particular (productive woodland).
Example Map, showing the differences between the 100 and 250m resolutions:
Example table, showing some of the results of the lab: