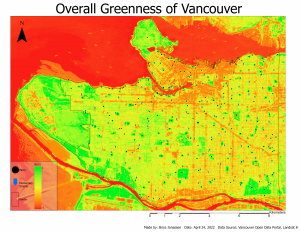
The NDVI analysis revealed a division between West and East Vancouver in terms of green space. Green is vegetation and red is non vegetation. The ocean is red, while urban areas and roads come across as more orange. Roads can be identified by the orang lines. The Overall Greenness of Vancouver map depicted above depicts NVDI values for Vancouver, and suggests that elementary schools located to the West of Vancouver (west of Main st.) have more access to green space. This is because West Vancouver appears to have higher overall NDVI values, indicating the West side of Vancouver is ‘greener’ or has more vegetation/green space than the East side. Excluding Stanley Park and Pacific Spirit Park, West Vancouver still appears more green in the above map than East Vancouver, which seems to be more orange and yellow. The 6-5-4 and 5-4-3 band combinations confirmed the NDVI results.
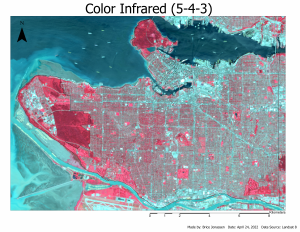
The 5-4-3 band combination is good for identifying vegetation types. Vegetation appears red, specifically coniferous vegetation comes across as darker red than broadleaf vegetation, and grass is lighter. Urban areas come across as light blue. In the 5-4-3 map depicted above, golf courses can be easily identified by their shape and almost pink coloration. Stanley park and Pacific Spirit Park are mostly dark red, which makes sense since their vegetation mostly consists of coniferous trees. Dense urban areas like Downtown Vancouver and Granville Island appear light blue. Roads also appear light blue. West Vancouver appears more red in the above map, where East Vancouver contains a little less red and a bit more light blue, which indicates West Vancouver has more vegetation or green space than East Vancouver, which is more urban. This supports the division depicted by the NDVI analysis.
Areas in red have better vegetation health, dark blue areas are water and dense urban areas are white. Less dense urban areas appear teal.
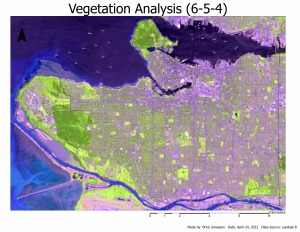
Vegetation is represented by bright green, and urban is shown as a light purple. Again, West Vancouver appears to have more vegetation as it appears to have more green hues than East Vancouver, which contains more purple hues. This again supports the division depicted in the NDVI analysis.
I also produced a true or natural color image of Vancouver to help make interrupting the above maps a bit easier as most people are attuned to picturing Vancouver in its true coloring.
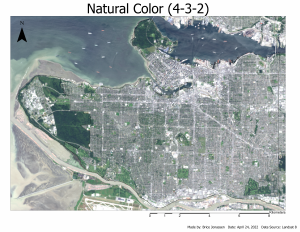
Even in the Natural Color (5-4-3) map depicted above, more greenness can be seen in West Vancouver, with East Vancouver appearing more urban.
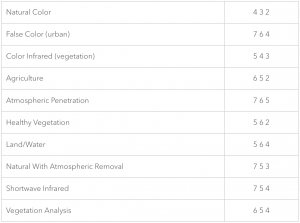
Landsat 8 bands and band combinations are depicted bellow, taken from ESRI’s website.

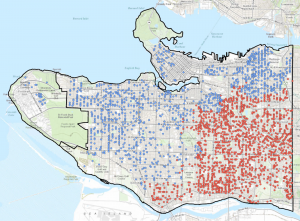
The first set of spatially constrained multivariate clustering analysis’ was conducted using Early Development Instrument (EDI) data, and showed an East – East division in Vancouver for EDI scores.
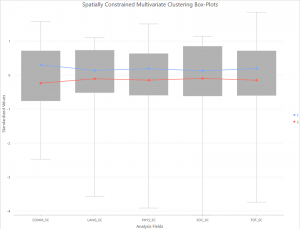
This analysis looked at 5 variables (physical, social, language, communication, and total scores), and showed that on average, the West side of Vancouver had higher EDI scores in all categories analyzed.
This analysis was redone, except this time only two variables were looked at, physical and social scores.
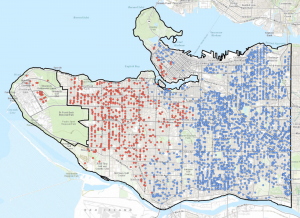

This analysis supports the previous observation, of a division between West and East Vancouver, with West Vancouver outperforming East Vancouver (i.e. having overall higher EDI scores for the categories analyzed).
There appears to be some correlation between green space and children’s development. There is clear division between West Vancouver and East Vancouver. West Vancouver appears to have higher EDI scores, seen through the spatially constrained multivariate clustering analysis’, as well as more overall green space, seen through NDVI and supporting band combinations. This supports the hypothesis that the amount of green space is positively correlated with EDI scores, which suggests that green space is beneficial for children’s development. However, further analysis was conducted in the hopes of providing more definite results.
A second round of spatially constrained multivariate clustering analysis was conducted. This time looking at mean EDI scores and the total amount of hectares of park space within each dissemination area (DA).
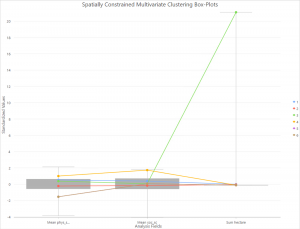
The first analysis looked at 6 variables; mean physical scores, mean social scores, mean language scores, mean communication scores, mean total scores and sum hectares.
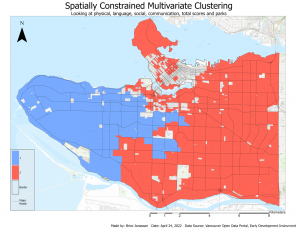
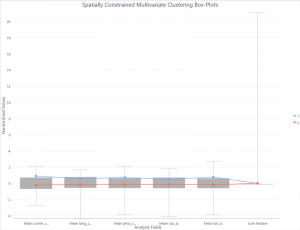
Again, there appears to be a West – East division. The only surprising result was that East Vancouver contained more total hectares of green space according to the box plots. This is misleading though, as in this analysis East Vancouver (shown in red) incorporates Stanley Park, which makes up a significant amount of hectares of green space. West Vancouver on the other hand, while it incorporates Pacific Spirit Park, there was no data for Pacific Spirit Park so even though it makes up a lot of hectares of green space, that green space isn’t accounted for in this analysis. That makes the results from this analysis a little untrustworthy, however it still points to a division between West and East Vancouver, and excluding Stanley Park, seems to support the theory that access to green space results in improved EDI scores.
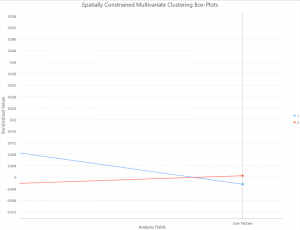
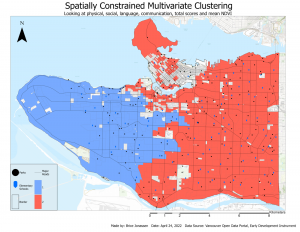
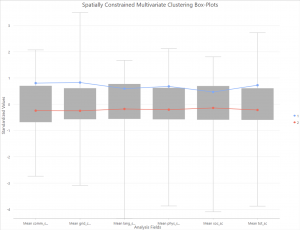
This analysis was redone, this time looking only at mean physical scores, mean social scores and sum hectares. The reason for this being that I believed physical and social scores would correlate well with outdoor activity and access to green space. The thought being that children who play outside get more exercise and interact with other children, therefore increasing their physical and social scores.
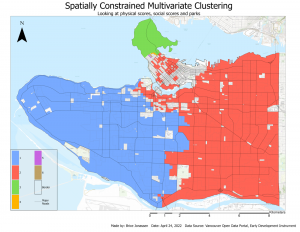
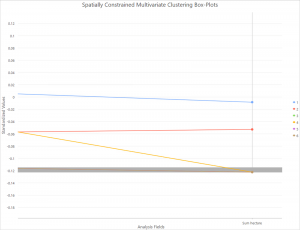
A West – East division can still be seen here. This time, Stanley Park was its own cluster though, so when looking at the box plots, West Vancouver has, on average, higher mean physical and social scores, as well as more total hectares of park space. Pacific Spirit Park still contains no data in this analysis. These results indicate there is positive correlation between green space and children’s EDI scores. Children’s development seems to be positively correlated with access to green space.
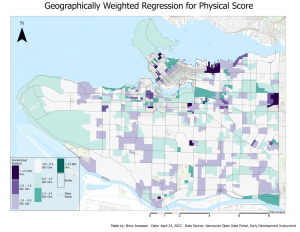
I then conducted a geographically weighted regression looking at mean physical scores and sum hectares. I was anticipating that DA’s which contained more park space would have higher physical scores as children would have more opportunity to play outside, improving their physical health.
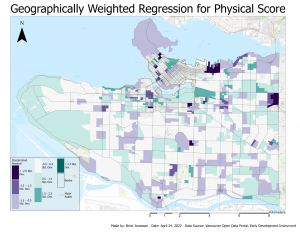
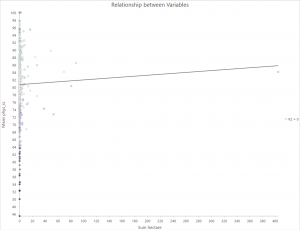
The dependent variable was mean physical scores, and the explanatory variable was sum hectares. The R2 value was 0.2088 and the adjusted R2 value was 0.1594, which indicates the model wasn’t the best fit for the data. Looking at the graph, there appears the be a positive correlation between total hectares and mean physical scores. However, the data is a little skewed, as Stanley Park is the only dot on the graph past 100 hectares.
Due to the troubles with looking at total hectares in relation to EDI scores, mean NDVI was calculated and some analysis was redone.
Looking at the above map and corresponding box plots, it can be seen there is a clear division between East and West, and not just that, but there are more elementary schools in located in East Vancouver. This analysis shows that green space is positively correlated with EDI scores. In the box plot, mean NDVI values are depicted as mean grid. On average, mean EDI scores were higher in DA’s that had higher NDVI values (higher overall greenness).
Finally I completed two more geographically weighted regressions, one for physical score and mean NDVI and the other for mean social score and mean NDVI. For the corresponding graphs below, mean grid code represents mean NDVI values.
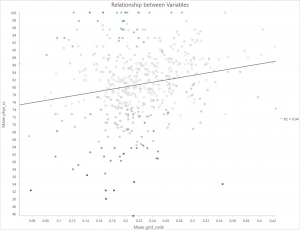
The R2 value was 0.2162 and the adjusted R2 value was 0.1618, so again the model isn’t the best fit for the data. However this time, the data is more evenly distributed. Looking at the graph, there is a positive correlation between NDVI values and physical scores. The trend line suggests that an increase in NDVI values results in an increase in physical scores.

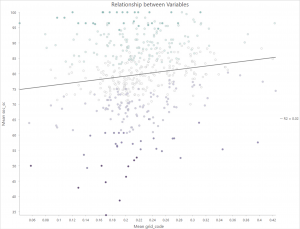
The R2 value was 0.0872 and the adjusted R2 value was 0.0581, so the model isn’t the best fit for the data. Looking at the graph, there is a positive correlation between NDVI values and social scores. The trend line suggests that as NDVI values, or overall greenness, increase, social scores also increase.