Hot Spot Analysis
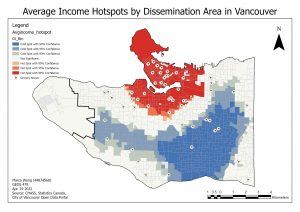
Figure 1) Hotspot Map
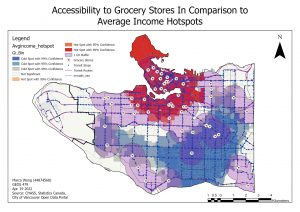
Figure 2) Buffer Map
As seen from Figure 1, the red areas represent the cluster of high average income. Whereas, the blue areas represent the low average income areas. The hotspot is concentrated in the downtown and surrounding False Creek area indicating that residents have a higher than average income. By adding the buffers for the grocery stores as seen in Figure 2, there is are some places that are not within the 1km buffer.
Spatially Constrained Multivariate Clustering
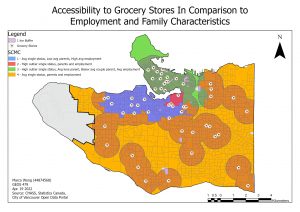
Figure 3) SCMC map
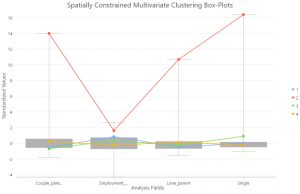
Figure 4) Variables for each cluster in Figure 3
The SCMC originally found 2 clusters, indicating that the range in each of the variables were not significantly wide. As a result, I changed the tool to generate 4 clusters instead to display any differences in clusters within the boxplot as seen in Figure 4.
Discussion
The results show that there is some correlation between income and location of grocery stores. From Figure 2, the hotspot analysis has shown that more grocery stores are located on the hotspots in comparison to the cold spots. As a result, the blue areas that are not within the 1km buffer would be considered a food desert as these grocery stores are not within walkable distance. These areas are South Vancouver and parts of East Vancouver. In order for residents within the food desert, taking transit would be the best option to access the grocery store even though it would come with an additional price.
In terms of the SCMC analysis, there was some correlation between the access to grocery stores and employment and family characteristics. Areas such as downtown and the False Creek Area have better access and choices to a variety of grocery stores. The characteristics of the cluster have a higher population of single status and lower population of families. Whereas in the identified food desert, there is an average rate of employment and distribution of different family types.
To summarize, the identified food desert affects the general population, there is some correlation between the average income and locations of grocery stores. More research could be conducted on transit and roads with the network analysis tool. However, since this feature was a paid extension, I used a buffer as a substitute for the network analysis. Moreover, this project focused on the status of the population based on family dynamics and income. As a result more research could be built on top of this analysis with the inclusion of ethnic minorities specifically the Indigenous demographic.