In this lab we conducted an assessment of land use change around Edmonton, Alberta between 1966 and 1976. I focused my study on urban land use change to measure urban expansion over 10 years.
The amount of urban built-up areas in Alberta increased almost tri-fold over these ten years from 19,596 hectares in 1966 to 54995 hectares in 1976. However, the growth was seen not only in the expansion of the city core but also in an increase in number and size of disjunct areas. The urban areas were built on what was previously cropland, pastures and productive woodland. Further rapid urban growth is expected and an effective land use management plan is necessary to manage urban expansion with minimal costs to the surrounding environment.
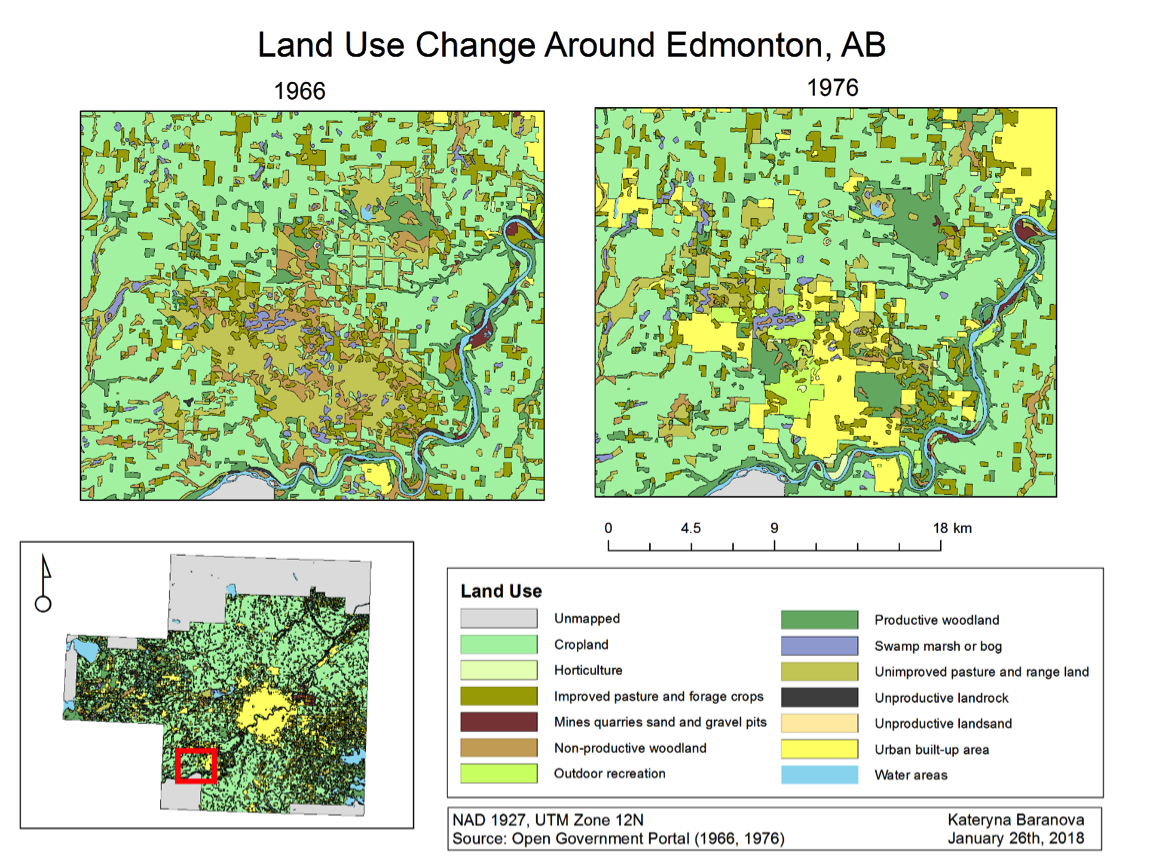
The data used for analysis in this report was retrieved from the Open Government Portal. The analysis uses CLUMP (Canada Land Use Monitoring Program) data for Edmonton, Alberta in the years of 1966 and 1976. It includes 14 land use classes that were sorted based on air photo interpretation, field surveys and census information. ArcGIS was used to produce two maps depicting various land use classes in 1966 and 1976 (Map 1) and then looked closer at urbanization of the urban core (Map 2) and the peripheral land (Map 3). It can instantly be seen (Map 1) that both the core and peripheral areas experienced rapid urban growth over 10 years. The built-up areas increased in number and size taking over other land uses. If we look at the core urban area of Edmonton (Map 2) we can see that it grew significantly, taking over what was cropland and pasture in 1966 and replacing. As mentioned above, the amount of disjunct areas around the core also increased with urbanization moving further away from the center. If we look at the change in one of such areas (Map 3) we can see that urbanization replaced pastures, cropland and marshes.
Through using FragStat for analysis, the total area of the built-up areas class increased by 35399 hectares with the total core area increasing by 22560 hectares. Built-up areas almost triple and came to occupy 8.5407% of the study area in 1976 compared to only 3.0413% in 1966. The number of disjunct urban areas also increased from 88 to 384 within ten years indicating a shift away from the core urban area (Table 1). Although the number of patches increased greatly for urban areas from 133 to 417 the number of patches for the whole landscape decreased by 209 therefore indicating a loss in landscape diversity most likely caused by urbanization (Table 2).
To analyze where the increase in the built-up areas came from in 1976 we created a transition matrix (Table 3). We can see that built-up areas from 1966 contributed only 35.63% of the total 1976 area. Most of the 1976 built-up areas came from cropland 38.88% followed by unimproved pastures and range land 13.51% and productive woodland 5.00%. Figure 2 you can see the complete breakdown of what land use classes in 1966 have been converted to built up areas in 1976. Can conversion of productive land to urban areas can be problematic in the long term therefore it is important to understand where urban growth comes from.
In figure 1 we can see the land use total areas by classes between 1966 and 1976. We can see that most land use classes decrease in area that they occupy and the two most significant increases can be attributed to built up areas and productive woodland. The latter can be explained by the maturation of unproductive forest land from 1966 to 1976.
Table 1: Changes in class level metrics for land use in Edmonton, Alberta between 1966 and 1976.
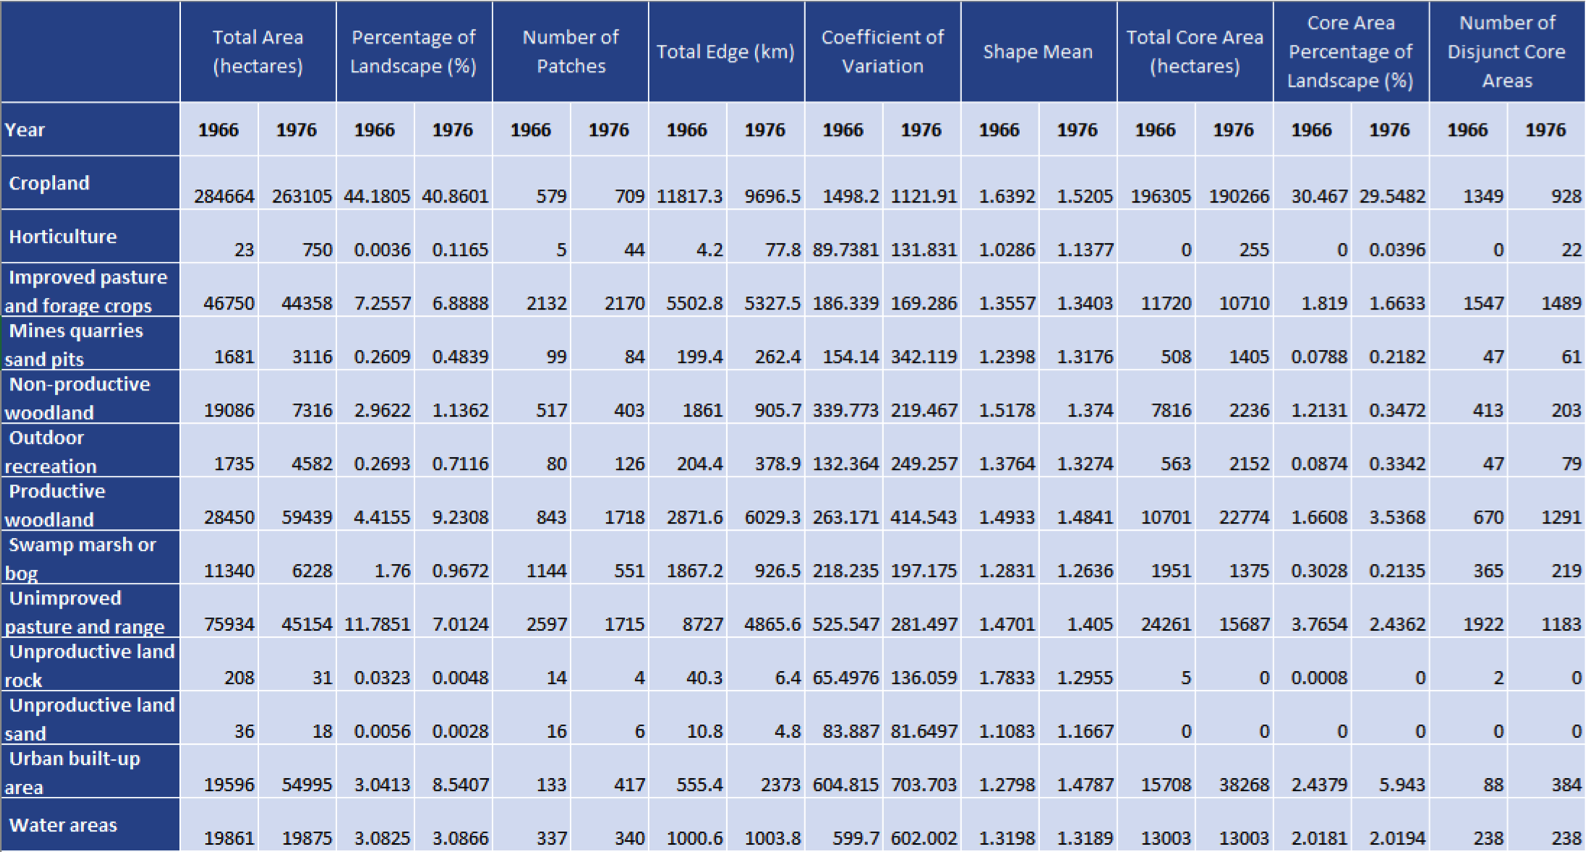
Table 2: Changes in landscape level metrics for land use in Edmonton, Alberta between 1966 and 1976.
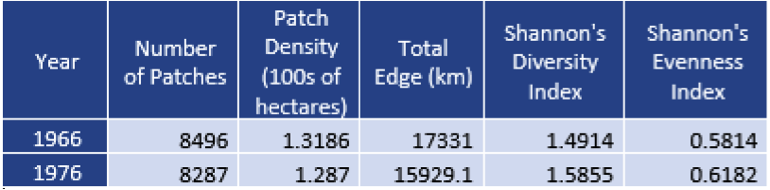
Table 3: Transition matrix depicting where the change in land use in 1976 came from.

Table 4: Description of class and landscape metrics used.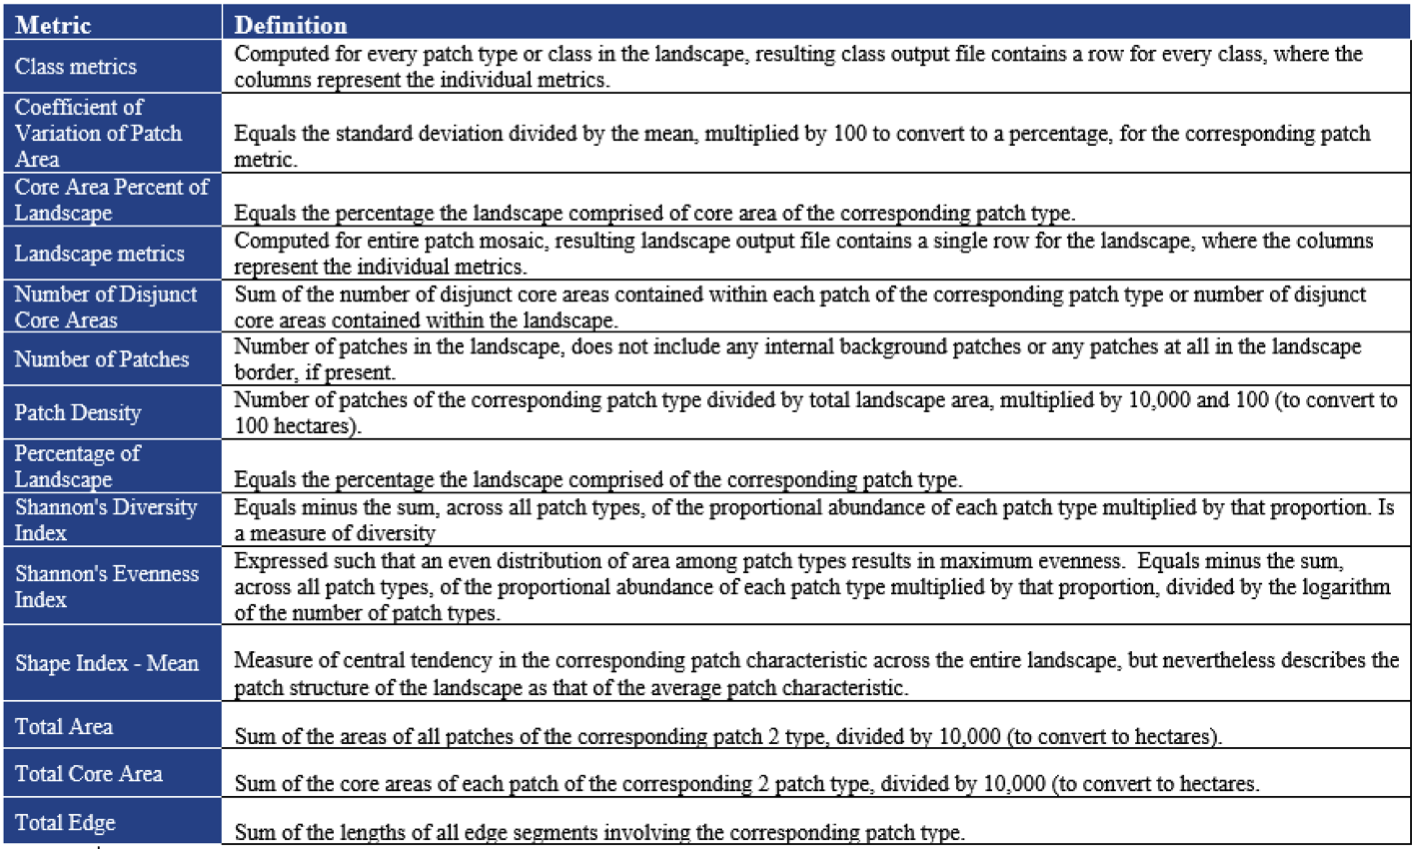
Figure 1: Total areas of land use classes in 1966 and 1976.

Figure 2: Land use class change to urban built up in 1976.

Map 1: Land use change between 1966 and 1976 in Edmonton, AB.

Map 2: Land use change in the core urban center of Edmonton, AB between 1966 and 1976.

Map 3: Land use change in the peripheral urban area in Edmonton, AB between 1966 and 1976.
References
Open Government Portal. n.d. Edmonton CLUMP 1966, 1976. Retrieved from
http://open.canada.ca/data/en/dataset?organization=nrcan-rncan
Kevin McGarigal. 2015. Fragstats Help. Retrieved from
http://www.umass.edu/landeco/research/fragstats/documents/fragstats.help.4.2.p