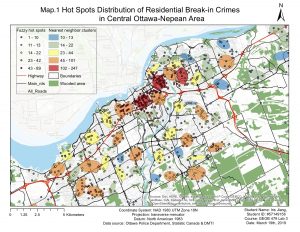
The lab analyzed the spatial pattern of three types of crime in Ottawa, Canada by using CrimeStat and ArcGIS. First, it used the nearest neighbor analysis to measure the spatial distribution of the pattern and to check whether the pattern is dispersed, randomly distributed or clustered for commercial break & in, residential break & in and car theft crimes. Then, it used the Moran’s I statistics to measure spatial autocorrelation based on both feature locations and feature values simultaneously (ArcMap, n.a.), to examine whether the data is positive, negative or random distributed. Hot spots distributions were conducted by both the fuzzy and risk-adjusted nearest neighborhoods, following by the single and dual-kernel density for generalizing incident location to an entire area. Last, the Knox analysis was conducted to analyze the relationship between incidents in terms of both space and time.

