Lab 3. Crime Analysis in Ottawa

Standard

The lab analyzed the spatial pattern of three types of crime in Ottawa, Canada by using CrimeStat and ArcGIS. First, it used the nearest neighbor analysis to measure the spatial distribution of the pattern and to check whether the pattern is dispersed, randomly distributed or clustered for commercial break & in, residential break & in and car theft crimes. Then, it used the Moran’s I statistics to measure spatial autocorrelation based on both feature locations and feature values simultaneously (ArcMap, n.a.), to examine whether the data is positive, negative or random distributed. Hot spots distributions were conducted by both the fuzzy and risk-adjusted nearest neighborhoods, following by the single and dual-kernel density for generalizing incident location to an entire area. Last, the Knox analysis was conducted to analyze the relationship between incidents in terms of both space and time.

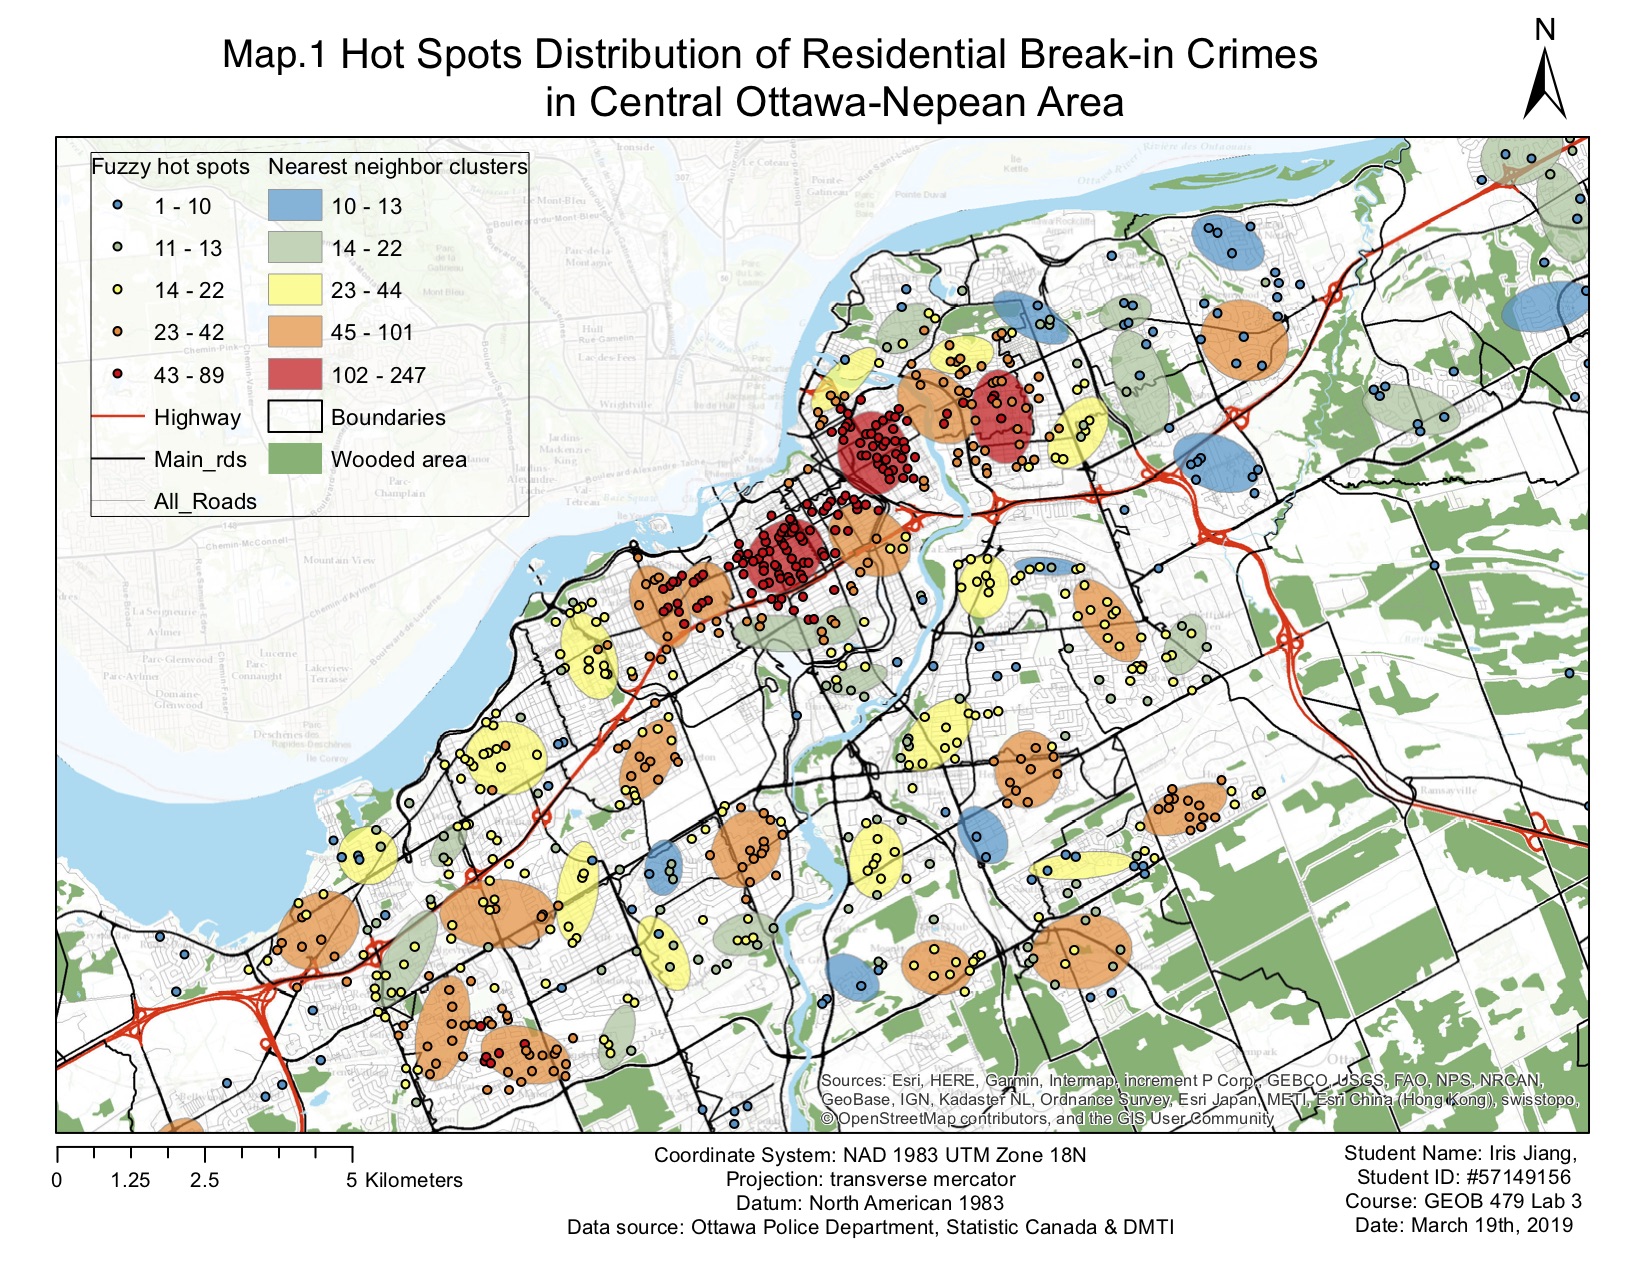
Figure 1. Hotspot Distribution of Residential Break-in Crime in Ottawa-Nepean area

Lab2. Geographically Weighted Regression — For Vancouver Children’s Social Scores

Standard

Geographically weighted regression (GWR) is a regional linear regression model which involves the consideration of spatial autocorrelation. It is popularly used in recent years for its better fitness than traditional OLS in explaining spatially varying relationship. The lab contains three parts. The first part is a general description of GWR, introducing its fundamental principles and advantages. The second part conducts a case study of GWR in Vancouver children’s social skill scores. The GWR result is analyzed and interpreted with the reference of a grouping analysis. OLS model is also built to compare the model fitness between the two regression models. The third part discusses how GWR can be applied in a broader environmental and socio-economic context.

In this lab, we explored the relationship between a child’s social skill ability and several variables related to the child and their neighborhood in the city of Vancouver. We found there were three most important parameters: gender, income, and language that would affect a child’ social skill ability. We modeled both global Ordinary least squares and local Geographically weighted regression by using the three parameters as explanatory variables to predict the social skill ability. And the result proofed that the better fitness of GWR than the OLS.

Figure 1. Grouping Analaysis Result

Lab 1. Landuse Change in Edmonton during 1966 – 1976

Standard

The lab conducted an analysis of land use change in Edomonton during 1966-1976 accompanies with the tools of ArcGIS, Excel, and Fragstats. The 10 years witnessed a rapid urban expansion in Edmonton. The city has expanded 3 times by transforming cropland, unimproved pasture land, productive and unproductive woodland. When we cheer for the achievement of the urbanization, more problems come to the front. First, the city showed a tendency of urban sprawling. The new built-up area had extended to the minefield. We should pay attention to the livelihood suitability for the residential area near the minefield. Also, the river passing through minefield may be polluted. Hence, water quality monitoring should be enhanced. Furthermore, the urban designer should also consider whether the fragmentation of woodland would affect the local biodiversity, and respond appropriately according to the condition.

Figure 1. Land use changes in Edmonton, Alberta 1966-1976