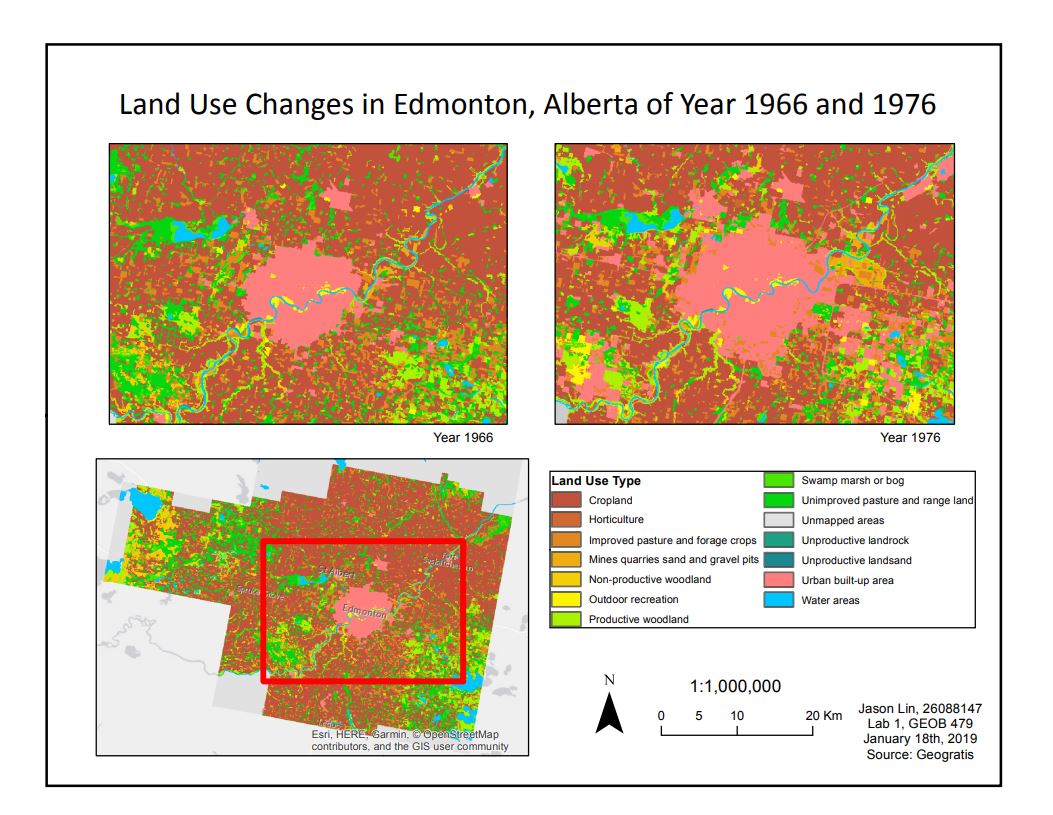
In this first lab exercise, I explored the land use changes in Edmonton, Alberta from the year 1966 to 1967. Using the data gathered from the Canada Land Use Monitoring Program (CLUMP) from Geogratis website, our main objective is to examine the trend and changes in agricultural land and urbanization.
From the class metrics, I observed a significant decrease in agricultural land types as they are being converted into urban built-up areas. At the same time, I observed decreases from other agricultural land types: improved pasture and forage crops (2000 hectares), non-productive woodland (12,000 hectares), swamp marsh or bog (5000 hectares), unimproved pasture and range land (30,000 hectares).
Additionally, it may be helpful to understand which land use types are being converted into another using transition matrix. Transition matrix offers us a clear picture to examine these land use conversions. For example, looking at horticulture, I can see that in 1976, only 1.86% of the land was from 1966 originally, however around 85% of its new land were converted from cropland.
Overall, rapid land use changes took place between year 1966 to 1976, population growth has accelerated urbanization in Edmonton, Alberta. This can be seen clearly on both maps where they show both the zoomed in area of the city center and the suburban areas. Urbanization leads to several regional impacts such as fragmentation of different land use type and the reduction of agricultural land.
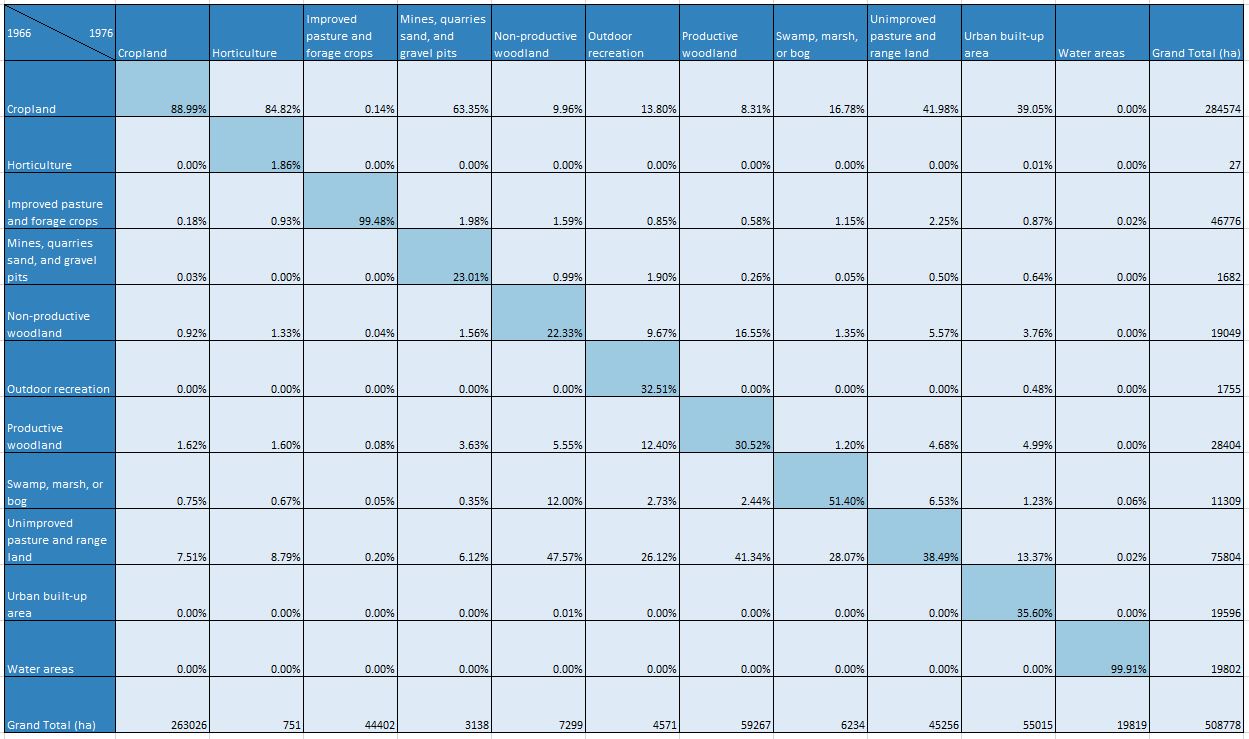
Transition Matrix showing changes in land use between different class types in Edmonton, Alberta between 1966 and 1976.